

Vue에서 vue2-highcharts를 사용하여 최상위 기능 구현(자세한 튜토리얼)
이제 Vue에서 최상위 기능을 구현하기 위해 vue2-highcharts를 사용하는 예를 공유하겠습니다. 이는 좋은 참고 가치가 있으며 모든 사람에게 도움이 되기를 바랍니다.
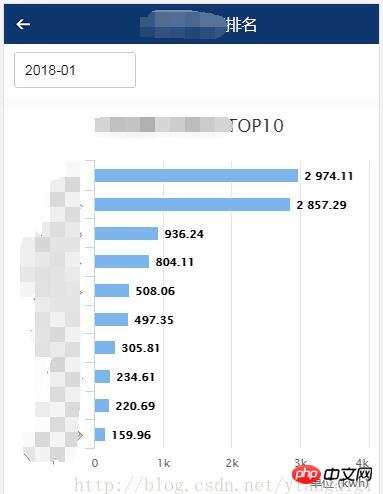
1 달성할 효과는 다음과 같습니다.
2 먼저
package.json에서 다음과 같이 vue2-highcharts를 참조하세요.
명령줄 입력: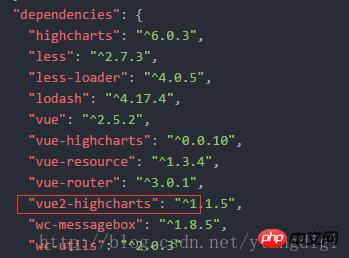
cnpm install vue2-highcharts
3. 페이지 코드는 다음과 같습니다.
위 내용은 모든 사람에게 도움이 되기를 바랍니다. 미래. 관련 기사: vue 페이지에서 DOM 작업이 작동하지 않는 문제 해결 nodejs는 QR 코드를 생성하는 매우 간단한 방법을 구현합니다. 위 내용은 Vue에서 vue2-highcharts를 사용하여 최상위 기능 구현(자세한 튜토리얼)의 상세 내용입니다. 자세한 내용은 PHP 중국어 웹사이트의 기타 관련 기사를 참조하세요!<template>
<p >
<p>
<p id="transparent-header" class="rank-head container" >
<img src="../assets/index/back.png" class="rank-head-back" @click="routerBack"/>
<span >用能排名</span>
</p>
</p>
<p >
<p >
<datepicker v-on:picked="picked" style="margin-left:10px;"></datepicker>
</p>
<p >
</p>
</p>
<p >
<p class="charts">
<vue-highcharts :options="options" ref="maxLineCharts"></vue-highcharts>
</p>
</p>
<p >
<p class="charts">
<vue-highcharts :options="options" ref="minLineCharts"></vue-highcharts>
</p>
</p>
</p>
</template>
<script>
import datepicker from '../components/datepicker.vue'
import VueHighcharts from 'vue2-highcharts'
export default {
data() {
return{
topHeight:240,
freezeMon:'',
ownerFreeData: [],
options:{
credits: {
enabled: false
},
legend: {
enabled: false
},
global: {
useUTC: false
},
chart: {
type: 'bar'
},
title: {
text: ' '
},
subtitle: {
text: ''
},
xAxis:[{
categories: ['1', '2', '3', '4', '5','6', '7', '8', '9', '10'],
title: {
text: null
},
labels: {
rotation: -45
}
}],
yAxis:[{
min: 0,
labels:{
overflow: 'justify'
},
title: {
text: '单位 (kwh)',
align: 'high'
}
}],
tooltip: {
formatter: function(){
return this.x+':'+this.y+'kwh';
}
},
credits: {
enabled: false
},
plotOptions: {
bar: {
dataLabels: {
enabled: true
}
},
series: [{
type: 'bar'
}]
}
}
}
},
methods: {
picked(year, month, date) {
if(month < 10){
this.freezeMon = `${year}-0${month}`;
}else{
this.freezeMon = `${year}-${month}`;
}
this.getList();
},
routerBack(){
this.$router.go(-1);
},
getList(){
let maxLineCharts = this.$refs.maxLineCharts;
let minLineCharts = this.$refs.minLineCharts;
if(maxLineCharts != null && minLineCharts != null){
//移除所有Series
maxLineCharts.removeSeries();
minLineCharts.removeSeries();
//设置标题名
maxLineCharts.getChart().title.update({ text: '用能最大TOP10' });
minLineCharts.getChart().title.update({ text: '用能最小TOP10' });
var userType = sessionStorage.getItem('userType');
var areaCode = sessionStorage.getItem('areaCode');
this.$http.post(this.URLINFO + '/mobile/rankingMonitor/getDayFreezeApp.do',{yearMonth:this.freezeMon,userType:userType,areaCode:areaCode})
.then(function (res) {
var seriesData = []
var categoriesData = []
for(var i = 0;i < res.data.max.length; i++) {
//maxLineCharts.addSeries({name:res.data.max[i][1],data: [{name: res.data.max[i][1],y:res.data.max[i][2]}]});
seriesData.push([res.data.max[i][1],res.data.max[i][2]]);
categoriesData.push(res.data.max[i][1]);
}
maxLineCharts.addSeries({name: '用能',data: seriesData});
maxLineCharts.getChart().xAxis[0].setCategories(categoriesData);
seriesData = []
categoriesData = []
for(var i = 0;i < res.data.min.length; i++) {
//minLineCharts.addSeries({name:res.data.min[i][1],data: [{name: res.data.min[i][1],y:res.data.min[i][2]}]});
seriesData.push([res.data.min[i][1],res.data.min[i][2]]);
categoriesData.push(res.data.min[i][1]);
}
minLineCharts.addSeries({name: '用能',data: seriesData});
minLineCharts.getChart().xAxis[0].setCategories(categoriesData);
})
.catch(function (error) {
this.$toast('查询排名信息异常');
});
}
}
},
components: {
datepicker,
VueHighcharts
},
mounted () {
this.getList()
}
}
</script>
<style>
*{margin:0;padding:0; list-style:none }
h1,h2,h3,h4,h5,h6{font-size:16px; font-weight:normal;}
.rank-head{
width: 100%;
height: 40px;
position:fixed;
background: -webkit-linear-gradient(top,rgba(0,0,0,.6),rgba(0,0,0,0));
z-index: 999;
color: #fff;
font-size: 16px;
text-align: center;
line-height: 40px;
}
.container{
width: 100%;
overflow: hidden
}
.rank-head-back{
display: block;
float: left;
width: 40px;
height: 40px;
background: url("../assets/index/back.png") no-repeat center center;
background-size: 100% 100%;
}
</style>

핫 AI 도구

Undresser.AI Undress
사실적인 누드 사진을 만들기 위한 AI 기반 앱

AI Clothes Remover
사진에서 옷을 제거하는 온라인 AI 도구입니다.

Undress AI Tool
무료로 이미지를 벗다

Clothoff.io
AI 옷 제거제

AI Hentai Generator
AI Hentai를 무료로 생성하십시오.

인기 기사
뜨거운 도구

메모장++7.3.1
사용하기 쉬운 무료 코드 편집기

SublimeText3 중국어 버전
중국어 버전, 사용하기 매우 쉽습니다.

스튜디오 13.0.1 보내기
강력한 PHP 통합 개발 환경

드림위버 CS6
시각적 웹 개발 도구

SublimeText3 Mac 버전
신 수준의 코드 편집 소프트웨어(SublimeText3)
뜨거운 주제
 7529
7529
 15
1378
52
81
11
54
19
21
76
15
1378
52
81
11
54
19
21
76

 vivox100s와 x100의 차이점: 성능 비교 및 기능 분석
Mar 23, 2024 pm 10:27 PM
vivox100s와 x100의 차이점: 성능 비교 및 기능 분석
Mar 23, 2024 pm 10:27 PM
vivox100s와 x100 휴대폰은 모두 in vivo 휴대폰 제품군의 대표적인 모델입니다. 두 휴대폰은 각각 서로 다른 시대의 vivo 첨단 기술 수준을 대표하므로 디자인, 성능, 기능 면에서 일정한 차이가 있습니다. 이번 글에서는 소비자들이 자신에게 꼭 맞는 휴대폰을 선택할 수 있도록 두 휴대폰을 성능비교와 기능분석 측면에서 자세히 비교해보겠습니다. 먼저 vivox100s와 x100의 성능 비교를 살펴보겠습니다. vivox100s에는 최신 기술이 탑재되어 있습니다.
 Huawei 휴대폰에서 이중 WeChat 로그인을 구현하는 방법은 무엇입니까?
Mar 24, 2024 am 11:27 AM
Huawei 휴대폰에서 이중 WeChat 로그인을 구현하는 방법은 무엇입니까?
Mar 24, 2024 am 11:27 AM
Huawei 휴대폰에서 이중 WeChat 로그인을 구현하는 방법은 무엇입니까? 소셜 미디어의 등장으로 WeChat은 사람들의 일상 생활에 없어서는 안될 커뮤니케이션 도구 중 하나가 되었습니다. 그러나 많은 사람들이 동일한 휴대폰에서 동시에 여러 WeChat 계정에 로그인하는 문제에 직면할 수 있습니다. Huawei 휴대폰 사용자의 경우 듀얼 WeChat 로그인을 달성하는 것은 어렵지 않습니다. 이 기사에서는 Huawei 휴대폰에서 듀얼 WeChat 로그인을 달성하는 방법을 소개합니다. 우선, 화웨이 휴대폰과 함께 제공되는 EMUI 시스템은 듀얼 애플리케이션 열기라는 매우 편리한 기능을 제공합니다. 앱 듀얼 오픈 기능을 통해 사용자는 동시에
 셀프미디어란 정확히 무엇인가? 주요 특징과 기능은 무엇입니까?
Mar 21, 2024 pm 08:21 PM
셀프미디어란 정확히 무엇인가? 주요 특징과 기능은 무엇입니까?
Mar 21, 2024 pm 08:21 PM
인터넷의 급속한 발전으로 셀프미디어라는 개념은 사람들의 마음속에 깊이 뿌리내렸습니다. 그렇다면 셀프미디어란 정확히 무엇인가? 주요 특징과 기능은 무엇입니까? 다음에는 이러한 문제를 하나씩 살펴보겠습니다. 1. 셀프미디어란 정확히 무엇인가? We-media는 이름에서 알 수 있듯이 당신이 미디어라는 뜻입니다. 개인이나 팀이 인터넷 플랫폼을 통해 콘텐츠를 독립적으로 생성, 편집, 출판 및 전파할 수 있는 정보 매체를 말합니다. 신문, 텔레비전, 라디오 등과 같은 전통적인 미디어와 달리 셀프 미디어는 더욱 상호작용적이고 개인화되어 있어 모든 사람이 정보의 생산자이자 전파자가 될 수 있습니다. 2. 셀프미디어의 주요 특징과 기능은 무엇입니까? 1. 낮은 문턱: 셀프미디어의 등장으로 미디어 산업에 진출하기 위한 문턱이 낮아졌습니다. 더 이상 번거로운 장비와 전문팀이 필요하지 않습니다.
 PHP 프로그래밍 가이드: 피보나치 수열을 구현하는 방법
Mar 20, 2024 pm 04:54 PM
PHP 프로그래밍 가이드: 피보나치 수열을 구현하는 방법
Mar 20, 2024 pm 04:54 PM
프로그래밍 언어 PHP는 다양한 프로그래밍 논리와 알고리즘을 지원할 수 있는 강력한 웹 개발 도구입니다. 그중 피보나치 수열을 구현하는 것은 일반적이고 고전적인 프로그래밍 문제입니다. 이 기사에서는 PHP 프로그래밍 언어를 사용하여 피보나치 수열을 구현하는 방법을 소개하고 구체적인 코드 예제를 첨부합니다. 피보나치 수열은 다음과 같이 정의되는 수학적 수열입니다. 수열의 첫 번째와 두 번째 요소는 1이고 세 번째 요소부터 시작하여 각 요소의 값은 이전 두 요소의 합과 같습니다. 시퀀스의 처음 몇 가지 요소
 Xiaohongshu 계정 관리 소프트웨어의 기능은 무엇입니까? Xiaohongshu 계정을 운영하는 방법은 무엇입니까?
Mar 21, 2024 pm 04:16 PM
Xiaohongshu 계정 관리 소프트웨어의 기능은 무엇입니까? Xiaohongshu 계정을 운영하는 방법은 무엇입니까?
Mar 21, 2024 pm 04:16 PM
Xiaohongshu가 젊은이들 사이에서 인기를 끌면서 점점 더 많은 사람들이 이 플랫폼을 사용하여 자신의 경험과 인생 통찰력의 다양한 측면을 공유하기 시작했습니다. 여러 Xiaohongshu 계정을 효과적으로 관리하는 방법이 중요한 문제가 되었습니다. 이 글에서는 Xiaohongshu 계정 관리 소프트웨어의 일부 기능에 대해 논의하고 Xiaohongshu 계정을 더 잘 관리하는 방법을 살펴보겠습니다. 소셜 미디어가 성장함에 따라 많은 사람들이 여러 소셜 계정을 관리해야 한다는 사실을 깨닫게 되었습니다. 이는 Xiaohongshu 사용자에게도 어려운 과제입니다. 일부 Xiaohongshu 계정 관리 소프트웨어는 자동 콘텐츠 게시, 예약 게시, 데이터 분석 및 기타 기능을 포함하여 사용자가 여러 계정을 보다 쉽게 관리할 수 있도록 도와줍니다. 이러한 도구를 통해 사용자는 자신의 계정을 보다 효율적으로 관리하고 계정 노출과 관심을 높일 수 있습니다. 또한 Xiaohongshu 계정 관리 소프트웨어에는
 Huawei 휴대폰에서 WeChat 복제 기능을 구현하는 방법
Mar 24, 2024 pm 06:03 PM
Huawei 휴대폰에서 WeChat 복제 기능을 구현하는 방법
Mar 24, 2024 pm 06:03 PM
Huawei 휴대폰에서 WeChat 복제 기능을 구현하는 방법 소셜 소프트웨어의 인기와 개인 정보 보호 및 보안에 대한 사람들의 강조가 높아지면서 WeChat 복제 기능이 점차 주목을 받고 있습니다. WeChat 복제 기능을 사용하면 사용자가 동일한 휴대폰에서 여러 WeChat 계정에 동시에 로그인할 수 있으므로 관리 및 사용이 더 쉬워집니다. Huawei 휴대폰에서 WeChat 복제 기능을 구현하는 것은 어렵지 않습니다. 다음 단계만 따르면 됩니다. 1단계: 휴대폰 시스템 버전과 WeChat 버전이 요구 사항을 충족하는지 확인하십시오. 먼저 Huawei 휴대폰 시스템 버전과 WeChat 앱이 최신 버전으로 업데이트되었는지 확인하세요.
 PHP 팁: 이전 페이지로 돌아가는 기능을 빠르게 구현
Mar 09, 2024 am 08:21 AM
PHP 팁: 이전 페이지로 돌아가는 기능을 빠르게 구현
Mar 09, 2024 am 08:21 AM
PHP 팁: 이전 페이지로 돌아가는 기능을 빠르게 구현하세요. 웹 개발을 하다 보면 이전 페이지로 돌아가는 기능을 구현해야 하는 경우가 종종 있습니다. 이러한 작업은 사용자 경험을 향상시키고 사용자가 웹 페이지 간을 더 쉽게 탐색할 수 있게 해줍니다. PHP에서는 몇 가지 간단한 코드를 통해 이 기능을 구현할 수 있습니다. 이번 글에서는 이전 페이지로 돌아가는 기능을 빠르게 구현하는 방법을 소개하고 구체적인 PHP 코드 예제를 제공하겠습니다. PHP에서는 $_SERVER['HTTP_REFERER']를 사용하여 이전 페이지의 URL을 가져올 수 있습니다.
 Golang이 어떻게 게임 개발 가능성을 가능하게 하는지 마스터하세요
Mar 16, 2024 pm 12:57 PM
Golang이 어떻게 게임 개발 가능성을 가능하게 하는지 마스터하세요
Mar 16, 2024 pm 12:57 PM
오늘날의 소프트웨어 개발 분야에서 효율적이고 간결하며 동시성이 뛰어난 프로그래밍 언어인 Golang(Go 언어)은 점점 더 개발자들의 선호를 받고 있습니다. 풍부한 표준 라이브러리와 효율적인 동시성 기능으로 인해 게임 개발 분야에서 주목받는 선택이 되었습니다. 이 기사에서는 게임 개발에 Golang을 사용하는 방법을 살펴보고 특정 코드 예제를 통해 Golang의 강력한 가능성을 보여줍니다. 1. 게임 개발에서 Golang의 장점 Golang은 정적인 유형의 언어로서 대규모 게임 시스템을 구축하는 데 사용됩니다.
