本篇文章给大家详细介绍一下用Python的第三方库openpyxl画真散点图的方法。有一定的参考价值,有需要的朋友可以参考一下,希望对大家有所帮助。

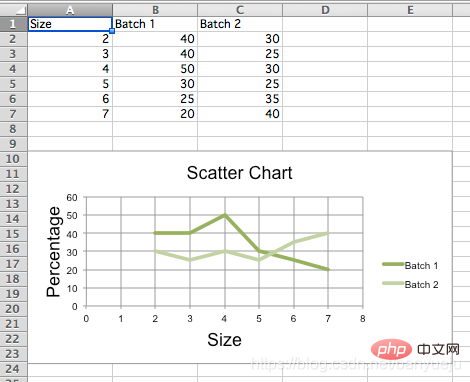
之前在博客上看见不少类似的问题,点进去一看,发现都是完全照抄的官方文档。然而官方文档的demo,画出来并不是我们想要的效果:

说好的散点图,出来却是我们一般定义上的折线图。
直接上代码:
先安装openpyxl第三方库,以Windows为例,在cmd指令窗下发如下命令:
pip install openpyxl
Python代码如下:
"""
__author__ = '伴月雎'
__time__ = '2021/4/21 19:15'
"""
from openpyxl import Workbook
from openpyxl.chart import (
    ScatterChart,
    Reference,
    Series,
)

wb = Workbook()
ws = wb.active
rows = [
    ['Size', 'Batch 1', 'Batch 2'],
    [2, 40, 30],
    [3, 40, 25],
    [4, 50, 30],
    [5, 30, 25],
    [6, 25, 35],
    [7, 20, 40],
]
for row in rows:
    ws.append(row)

chart = ScatterChart()
chart.title = "Scatter Chart"
chart.style = 10
chart.x_axis.title = 'Size'
chart.y_axis.title = 'Percentage'

xvalues = Reference(ws, min_col=1, min_row=2, max_row=7)
for i in range(2, 4):
    values = Reference(ws, min_col=i, min_row=1, max_row=7)
    series = Series(values, xvalues, title_from_data=True)
    chart.series.append(series)
# 第一条散点
s1 = chart.series[0]
# 散点标记类型  'auto', 'dash', 'triangle', 'square', 'picture', 'circle', 'dot', 'plus', 'star', 'diamond', 'x'
s1.marker.symbol = "circle"
s1.marker.graphicalProperties.solidFill = "0000FF"  # Marker filling 设定标记填充的颜色
s1.marker.graphicalProperties.line.solidFill = "0000FF"  # Marker outline 标记轮廓的颜色
s1.graphicalProperties.line.noFill = True  # 关闭连线填充

# 第二条带连线的散点
s2 = chart.series[1]
s2.marker.symbol = "circle"
s2.graphicalProperties.solidFill = "FF0000"
s2.marker.graphicalProperties.line.solidFill = "FF0000"
s2.graphicalProperties.dashStyle = "dash"
s2.graphicalProperties.line.width = 1000  # width in EMUs

ws.add_chart(chart, "A10")
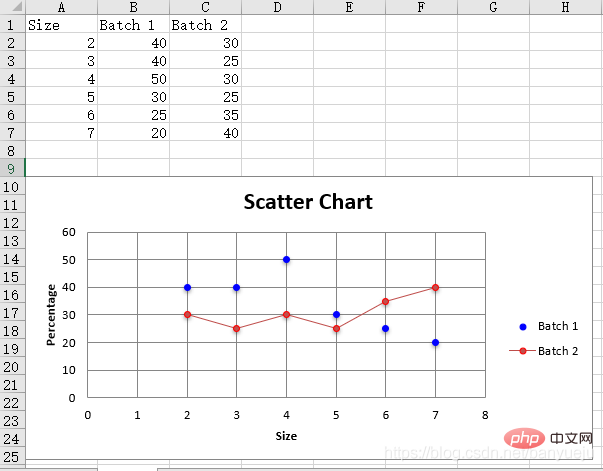
wb.save("scatter.xlsx")效果如下:

大家可以根据自己的需要做相应的扩展:
1.读取自己的Excel表格数据,替换上面代码中手动生成的数据:
        wb = openpyxl.load_workbook('D:\\data.xlsx')  # 填写你的Excel文件路径
ws = workbook['sheet1'] # 填写你的sheet标题再参考上述代码,指定你的xvalues和values(即x轴,y轴)对应的行、列位就OK了。
2.最后修改画图元素的属性值,画出你自己定制化的散点图!
相关免费学习推荐:python视频教程!
위 내용은 1분 안에 Python의 타사 라이브러리 openpyxl을 사용하여 실제 분산형 차트를 그리는 방법을 알아보세요.의 상세 내용입니다. 자세한 내용은 PHP 중국어 웹사이트의 기타 관련 기사를 참조하세요!