

Python을 사용하여 모두를 놀라게 할 멋진 gif 애니메이션을 그려보세요.


이전 기사에서 편집자는 Pythongif만들기 위한 모듈gif 형식 차트는 Python当中的gif模块来制作gif格式的图表,
厉害了,用Python绘制动态可视化图表,并保存成gif格式今天小编再给大家来介绍一种制作gif格式图表的新方法,调用的是matplotlib的相关模块,其中的步骤与方法也是相当地简单易懂。
下载和导入数据库
我们这次用到的数据集是bokeh模块自带的数据集,通过下面这一行代码直接就可以下载
import bokeh
bokeh.sampledata.download()
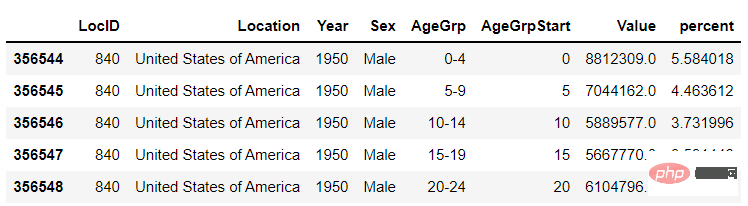
然后导入后面要用到的数据集,我们挑选的是指定国家的1950年至今不同年龄阶段的人口所占比重的数据
from bokeh.sampledata.population import data
import numpy as np

data = filter_loc('United States of America')
data.head()
output
先绘制若干张静态的图表
我们可以先绘制若干张静态的图表,然后将这几张图表合成一张gif格式的动图即可,代码如下
import seaborn as sns
import matplotlib.pyplot as plt
import matplotlib.patheffects as fx

# 绘制图表的函数
def make_plot(year):

    # 根据年份来筛选出数据
    df = data[data.Year == year]

    # 制作图表
    fig, (ax1, ax2) = plt.subplots(1, 2, sharey = True)
    ax1.invert_xaxis()
    fig.subplots_adjust(wspace = 0)

    ax1.barh(df[df.Sex == 'Male'].AgeGrp, df[df.Sex == 'Male'].percent, label = 'Male')
    ax2.barh(df[df.Sex == 'Female'].AgeGrp, df[df.Sex == 'Female'].percent, label = 'Female', color = 'C1')

    country = df.Location.iloc[0]
    if country == 'United States of America': country == 'US'

    fig.suptitle(f'......')
    fig.supxlabel('......')
    fig.legend(bbox_to_anchor = (0.9, 0.88), loc = 'upper right')
    ax1.set_ylabel('Age Groups')

    return fig
我们自定义了一个绘制图表的函数,其中的参数是年份,逻辑很简单,我们是想根据年份来筛选出数据,然后根据筛选出的数据来绘制图表,每一年的图表不尽相同
years = [i for i in set(data.Year) if i < 2022]
years.sort()

for year in years:
    fig = make_plot(year)
    fig.savefig(f'{year}.jpeg',bbox_inches = 'tight')
output
这样我们就生成了若干张静态的图表,然后集合成gif
gif< /code> 차트 서식 지정, <code style="font-family: monospace; 글꼴 크기: 상속; 배경색: rgba(0, 0, 0, 0.06); 패딩: 0px 2px; 테두리 반경: 6px; 라인- height: 상속; Overflow-wrap: break-word; text-indent: 0px;">matplotlib관련 모듈, 단계 및 방법도 매우 유사하여 이해하기 쉽습니다. 데이터베이스 다운로드 및 가져오기
 이번에 사용한 데이터 세트는
import matplotlib.animation as animation
fig, ax = plt.subplots()
ims = []
for year in years:
im = ax.imshow(plt.imread(f'{year}.jpeg'), animated = True)
ims.append([im])
ani = animation.ArtistAnimation(fig, ims, interval=600)
ani.save('us_population.gif')
</pre><h3 >를 통해 직접 다운로드한 다음 나중에 사용할 데이터 세트로 가져올 수 있습니다. 1950년부터 현재까지의 비중 데이터<span style="color: #2b2b2b;"><div class="code" style="position:relative; padding:0px; margin:0px;"><pre class='brush:php;toolbar:false;'>fig, (ax1, ax2) = plt.subplots(1, 2, sharey = True)
df = data[data.Year == 1955]
y_pos = [i for i in range(len(df[df.Sex == 'Male']))]
male = ax1.barh(y_pos, df[df.Sex == 'Male'].percent, label = 'Male',
tick_label = df[df.Sex == 'Male'].AgeGrp)
female = ax2.barh(y_pos, df[df.Sex == 'Female'].percent, label = 'Female',
color = 'C1', tick_label = df[df.Sex == 'Male'].AgeGrp)
ax1.invert_xaxis()
fig.suptitle('.......')
fig.supxlabel('....... (%)')
fig.legend(bbox_to_anchor = (0.9, 0.88), loc = 'upper right')
ax1.set_ylabel('Age Groups')
</pre><div class="contentsignin">로그인 후 복사</div></div></span>output</h3><p ><img src="/static/imghw/default1.png" data-src="https://img.php.cn/upload/article/000/887/227/168318834873391.png" class="lazy" alt="Python을 사용하여 그리기 멋진 gif 애니메이션, 다들 놀라워요" /></p><p ></p>먼저 여러 개의 정적 차트를 그립니다<p style="max-width:90%"><img src="/static/imghw/default1.png" data-src="https://img.php.cn/upload/article/000/887/227/168318834943111.png" class="lazy" alt="Python을 사용하여 모두를 놀라게 할 멋진 gif 애니메이션을 그려보세요." /></p>먼저 여러 개의 정적 차트를 그린 다음 이 차트를 하나로 결합할 수 있습니다.<code style="max-width:90%"brush:php;toolbar:false;'>def run(year):
# 通过年份来筛选出数据
df = data[data.Year == year]
# 针对不同地性别来绘制
total_pop = df.Value.sum()
df['percent'] = df.Value / total_pop * 100
male.remove()
y_pos = [i for i in range(len(df[df.Sex == 'Male']))]
male.patches = ax1.barh(y_pos, df[df.Sex == 'Male'].percent, label = 'Male',
color = 'C0', tick_label = df[df.Sex == 'Male'].AgeGrp)
female.remove()
female.patches = ax2.barh(y_pos, df[df.Sex == 'Female'].percent, label = 'Female',
color = 'C1', tick_label = df[df.Sex == 'Female'].AgeGrp)
text.set_text(year)
return male#, female
</pre></p>차트를 그리는 기능을 사용자 정의했습니다. 논리는 매우 간단합니다. Year를 선택하여 데이터를 필터링한 다음, 필터링된 데이터를 기반으로 차트를 그립니다. 각 연도의 차트는 다릅니다🎜<div class="code" style="position:relative; padding:0px; margin:0px;"><div class="code" style="position:relative; padding:0px; margin:0px;"><pre class='brush:php;toolbar:false;'>ani = animation.FuncAnimation(fig, run, years, blit = True, repeat = True,
interval = 600)
ani.save('文件名.gif')
</pre><div class="contentsignin">로그인 후 복사</div></div><div class="contentsignin">로그인 후 복사</div></div>🎜output🎜🎜<img src="/static/imghw/default1.png" data-src="https://img.php.cn/upload/article/000/887/227/168318834978200.gif" class="lazy" alt="Python을 사용하여 모두를 놀라게 하는 멋진 gif 애니메이션을 그립니다." />🎜🎜이러한 방식으로 여러 정적 차트를 생성한 다음 이를 <code style= " 글꼴 계열: 고정폭; 글꼴 크기: 상속; 배경색: rgba(0, 0, 0, 0.06); 테두리 반경: 6px; 상속; word; text-indent: 0px;">gif 형식의 여러 차트, 코드는 다음과 같습니다🎜
import matplotlib.animation as animation

# 创建一个新的画布
fig, (ax, ax2, ax3) = plt.subplots(1, 3, figsize = (10, 3))

ims = []
for year in years:
    im = ax.imshow(plt.imread(f'文件1{year}.jpeg'), animated = True)
    im2 = ax2.imshow(plt.imread(f'文件2{year}.jpeg'), animated = True)
    im3 = ax3.imshow(plt.imread(f'文件3{year}.jpeg'), animated = True)
    ims.append([im, im2, im3])

ani = animation.ArtistAnimation(fig, ims, interval=600)
ani.save('comparison.gif')
def run(year):
    # 通过年份来筛选出数据
    df = data[data.Year == year]
    # 针对不同地性别来绘制
    total_pop = df.Value.sum()
    df['percent'] = df.Value / total_pop * 100
    male.remove()
    y_pos = [i for i in range(len(df[df.Sex == 'Male']))]
    male.patches = ax1.barh(y_pos, df[df.Sex == 'Male'].percent, label = 'Male',
                     color = 'C0', tick_label = df[df.Sex == 'Male'].AgeGrp)
    female.remove()
    female.patches = ax2.barh(y_pos, df[df.Sex == 'Female'].percent, label = 'Female',

                 color = 'C1', tick_label = df[df.Sex == 'Female'].AgeGrp)

    text.set_text(year)
    return male#, female
然后我们调用animation.FuncAnimation()方法,
ani = animation.FuncAnimation(fig, run, years, blit = True, repeat = True,
                              interval = 600)
ani.save('文件名.gif')
output
这样就可以一步到位生成gif格式的图表,避免生成数十张繁多地静态图片了。
将若干张<span style="color: #2b2b2b;">gif</span>动图放置在一张大图当中
最后我们可以将若干张gif动图放置在一张大的图表当中,代码如下
import matplotlib.animation as animation

# 创建一个新的画布
fig, (ax, ax2, ax3) = plt.subplots(1, 3, figsize = (10, 3))

ims = []
for year in years:
    im = ax.imshow(plt.imread(f'文件1{year}.jpeg'), animated = True)
    im2 = ax2.imshow(plt.imread(f'文件2{year}.jpeg'), animated = True)
    im3 = ax3.imshow(plt.imread(f'文件3{year}.jpeg'), animated = True)
    ims.append([im, im2, im3])

ani = animation.ArtistAnimation(fig, ims, interval=600)
ani.save('comparison.gif')
output
위 내용은 Python을 사용하여 모두를 놀라게 할 멋진 gif 애니메이션을 그려보세요.의 상세 내용입니다. 자세한 내용은 PHP 중국어 웹사이트의 기타 관련 기사를 참조하세요!

핫 AI 도구

Undresser.AI Undress
사실적인 누드 사진을 만들기 위한 AI 기반 앱

AI Clothes Remover
사진에서 옷을 제거하는 온라인 AI 도구입니다.

Undress AI Tool
무료로 이미지를 벗다

Clothoff.io
AI 옷 제거제

Video Face Swap
완전히 무료인 AI 얼굴 교환 도구를 사용하여 모든 비디오의 얼굴을 쉽게 바꾸세요!

인기 기사
뜨거운 도구

메모장++7.3.1
사용하기 쉬운 무료 코드 편집기

SublimeText3 중국어 버전
중국어 버전, 사용하기 매우 쉽습니다.

스튜디오 13.0.1 보내기
강력한 PHP 통합 개발 환경

드림위버 CS6
시각적 웹 개발 도구

SublimeText3 Mac 버전
신 수준의 코드 편집 소프트웨어(SublimeText3)


 PHP와 Python : 다른 패러다임이 설명되었습니다
Apr 18, 2025 am 12:26 AM
PHP와 Python : 다른 패러다임이 설명되었습니다
Apr 18, 2025 am 12:26 AM
PHP는 주로 절차 적 프로그래밍이지만 객체 지향 프로그래밍 (OOP)도 지원합니다. Python은 OOP, 기능 및 절차 프로그래밍을 포함한 다양한 패러다임을 지원합니다. PHP는 웹 개발에 적합하며 Python은 데이터 분석 및 기계 학습과 같은 다양한 응용 프로그램에 적합합니다.
 PHP와 Python 중에서 선택 : 가이드
Apr 18, 2025 am 12:24 AM
PHP와 Python 중에서 선택 : 가이드
Apr 18, 2025 am 12:24 AM
PHP는 웹 개발 및 빠른 프로토 타이핑에 적합하며 Python은 데이터 과학 및 기계 학습에 적합합니다. 1.PHP는 간단한 구문과 함께 동적 웹 개발에 사용되며 빠른 개발에 적합합니다. 2. Python은 간결한 구문을 가지고 있으며 여러 분야에 적합하며 강력한 라이브러리 생태계가 있습니다.
 PHP와 Python : 그들의 역사에 깊은 다이빙
Apr 18, 2025 am 12:25 AM
PHP와 Python : 그들의 역사에 깊은 다이빙
Apr 18, 2025 am 12:25 AM
PHP는 1994 년에 시작되었으며 Rasmuslerdorf에 의해 개발되었습니다. 원래 웹 사이트 방문자를 추적하는 데 사용되었으며 점차 서버 측 스크립팅 언어로 진화했으며 웹 개발에 널리 사용되었습니다. Python은 1980 년대 후반 Guidovan Rossum에 의해 개발되었으며 1991 년에 처음 출시되었습니다. 코드 가독성과 단순성을 강조하며 과학 컴퓨팅, 데이터 분석 및 기타 분야에 적합합니다.
 Python vs. JavaScript : 학습 곡선 및 사용 편의성
Apr 16, 2025 am 12:12 AM
Python vs. JavaScript : 학습 곡선 및 사용 편의성
Apr 16, 2025 am 12:12 AM
Python은 부드러운 학습 곡선과 간결한 구문으로 초보자에게 더 적합합니다. JavaScript는 가파른 학습 곡선과 유연한 구문으로 프론트 엔드 개발에 적합합니다. 1. Python Syntax는 직관적이며 데이터 과학 및 백엔드 개발에 적합합니다. 2. JavaScript는 유연하며 프론트 엔드 및 서버 측 프로그래밍에서 널리 사용됩니다.
 숭고한 코드 파이썬을 실행하는 방법
Apr 16, 2025 am 08:48 AM
숭고한 코드 파이썬을 실행하는 방법
Apr 16, 2025 am 08:48 AM
Sublime 텍스트로 Python 코드를 실행하려면 먼저 Python 플러그인을 설치 한 다음 .py 파일을 작성하고 코드를 작성한 다음 CTRL B를 눌러 코드를 실행하면 콘솔에 출력이 표시됩니다.
 vscode에서 코드를 작성하는 위치
Apr 15, 2025 pm 09:54 PM
vscode에서 코드를 작성하는 위치
Apr 15, 2025 pm 09:54 PM
Visual Studio Code (VSCODE)에서 코드를 작성하는 것은 간단하고 사용하기 쉽습니다. vscode를 설치하고, 프로젝트를 만들고, 언어를 선택하고, 파일을 만들고, 코드를 작성하고, 저장하고 실행합니다. VSCODE의 장점에는 크로스 플랫폼, 무료 및 오픈 소스, 강력한 기능, 풍부한 확장 및 경량 및 빠른가 포함됩니다.
 Python에서 비주얼 스튜디오 코드를 사용할 수 있습니다
Apr 15, 2025 pm 08:18 PM
Python에서 비주얼 스튜디오 코드를 사용할 수 있습니다
Apr 15, 2025 pm 08:18 PM
VS 코드는 파이썬을 작성하는 데 사용될 수 있으며 파이썬 애플리케이션을 개발하기에 이상적인 도구가되는 많은 기능을 제공합니다. 사용자는 다음을 수행 할 수 있습니다. Python 확장 기능을 설치하여 코드 완료, 구문 강조 및 디버깅과 같은 기능을 얻습니다. 디버거를 사용하여 코드를 단계별로 추적하고 오류를 찾아 수정하십시오. 버전 제어를 위해 git을 통합합니다. 코드 서식 도구를 사용하여 코드 일관성을 유지하십시오. 라인 도구를 사용하여 잠재적 인 문제를 미리 발견하십시오.
 메모장으로 파이썬을 실행하는 방법
Apr 16, 2025 pm 07:33 PM
메모장으로 파이썬을 실행하는 방법
Apr 16, 2025 pm 07:33 PM
메모장에서 Python 코드를 실행하려면 Python 실행 파일 및 NPPEXEC 플러그인을 설치해야합니다. Python을 설치하고 경로를 추가 한 후 nppexec 플러그인의 명령 "Python"및 매개 변수 "{current_directory} {file_name}"을 구성하여 Notepad의 단축키 "F6"을 통해 Python 코드를 실행하십시오.
