Python을 사용하여 동적 막대 차트를 생성하는 방법
현재 공식 API 문서는 막대 차트의 소스 코드 예제만 제공합니다. 플랫폼이 너무 바빠서 문서를 작성할 시간이 없을 수도 있습니다!
from matplotlib import pyplot as plt
import pandas as pd
import pynimate as nim

df = pd.DataFrame(
    {
        "time": ["1960-01-01", "1961-01-01", "1962-01-01"],
        "Afghanistan": [1, 2, 3],
        "Angola": [2, 3, 4],
        "Albania": [1, 2, 5],
        "USA": [5, 3, 4],
        "Argentina": [1, 4, 5],
    }
).set_index("time")

cnv = nim.Canvas()
bar = nim.Barplot(df, "%Y-%m-%d", "2d")
bar.set_time(callback=lambda i, datafier: datafier.data.index[i].strftime("%b, %Y"))
cnv.add_plot(bar)
cnv.animate()
plt.show()pip를 사용하여 pynimate 모듈을 직접 설치하세요. 이 모듈은 각 미러 스테이션에서 제공해야 하는 Python 버전 3.9 이상을 직접 지원한다는 점에 유의하세요.
pip install pynimate

pip install matplotlib

pip install pandas
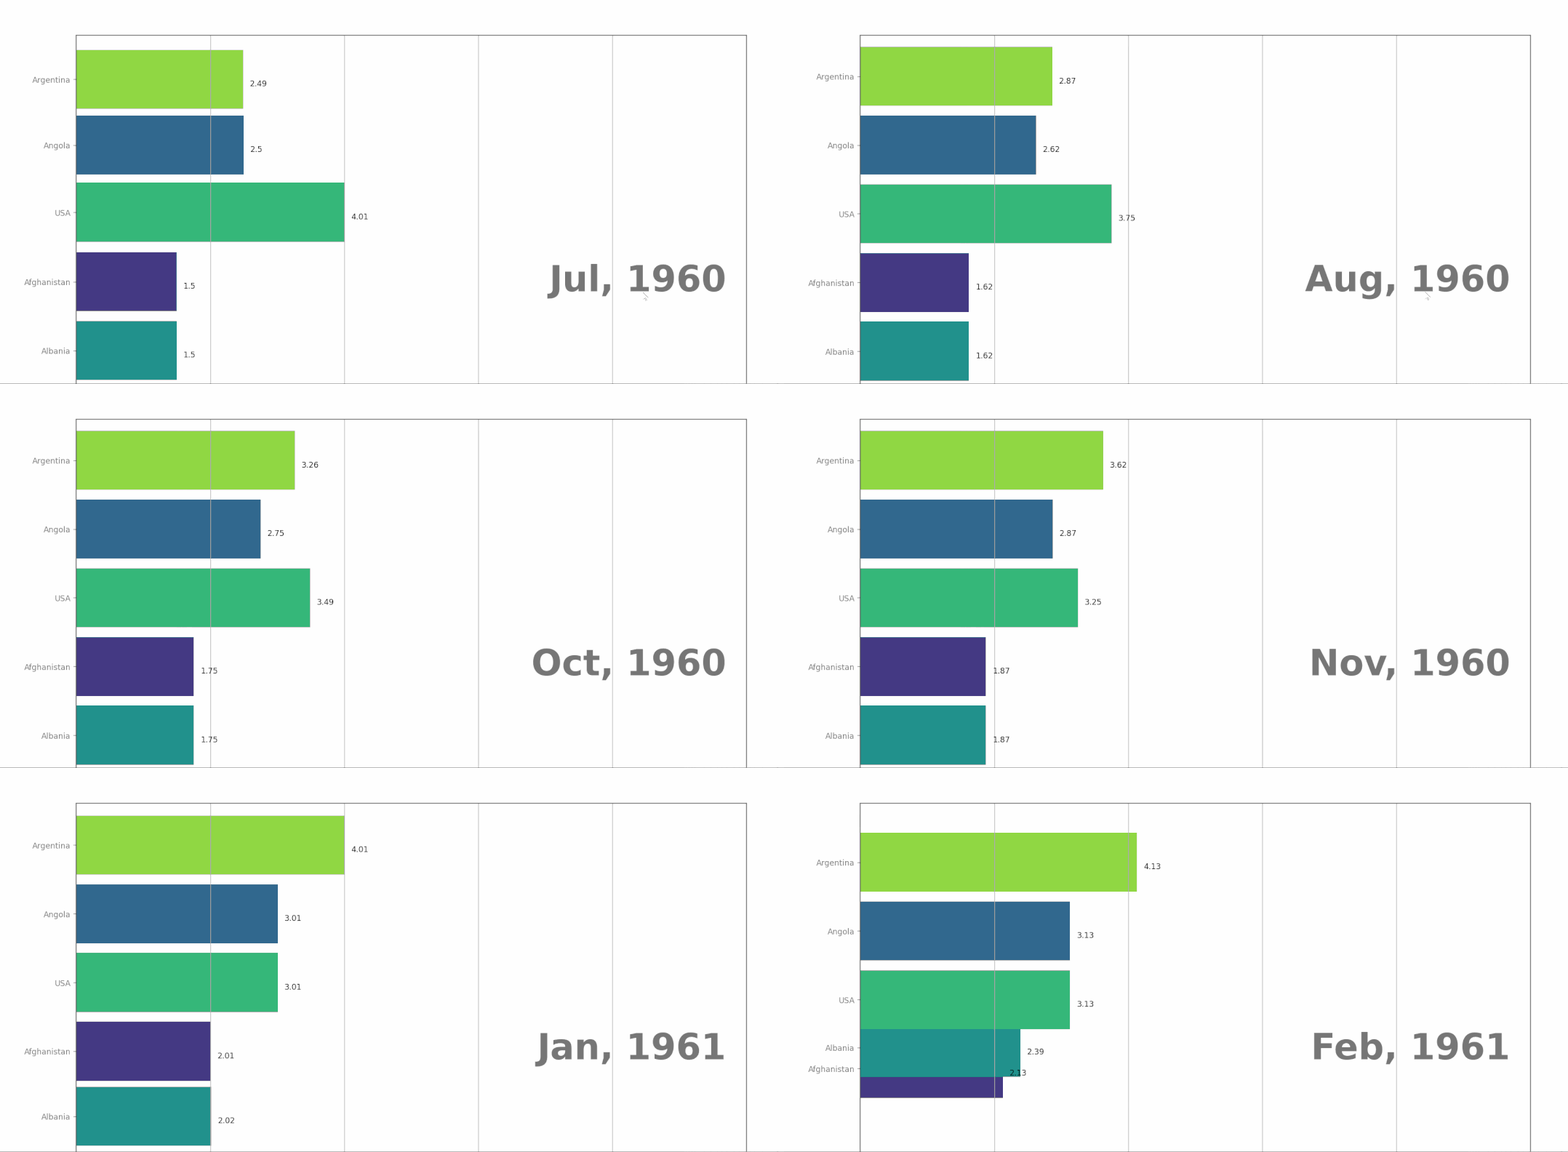
설치가 완료된 후 현재 .py 모듈을 직접 시작하면 다음과 같은 동적 막대 차트 효과가 나타납니다.

다른 Python 시각화 모듈에 비해 pynimate는 동적 그래픽의 실행 과정을 GIF 형식의 동적 그림으로 직접 저장할 수 있다는 점에서 탁월합니다.
cnv.save("file", 24, "gif")또한 pynimate 모듈의 작성자는 참조용으로 사용자 정의된 방식으로 시각적 동적 그래픽을 설정하는 방법도 제공합니다.
from matplotlib import pyplot as plt
import numpy as np
import pandas as pd
import os

dir_path = os.path.dirname(os.path.realpath(__file__))
import pynimate as nim


def post_update(ax, i, datafier, bar_attr):
    ax.spines["top"].set_visible(False)
    ax.spines["right"].set_visible(False)
    ax.spines["bottom"].set_visible(False)
    ax.spines["left"].set_visible(False)
    ax.set_facecolor("#001219")
    for bar, x, y in zip(
        bar_attr.top_bars,
        bar_attr.bar_length,
        bar_attr.bar_rank,
    ):
        ax.text(
            x - 0.3,
            y,
            datafier.col_var.loc[bar, "continent"],
            ha="right",
            color="k",
            size=12,
        )


df = pd.read_csv(dir_path + "/data/sample.csv").set_index("time")
col = pd.DataFrame(
    {
        "columns": ["Afghanistan", "Angola", "Albania", "USA", "Argentina"],
        "continent": ["Asia", "Africa", "Europe", "N America", "S America"],
    }
).set_index("columns")
bar_cols = {
    "Afghanistan": "#2a9d8f",
    "Angola": "#e9c46a",
    "Albania": "#e76f51",
    "USA": "#a7c957",
    "Argentina": "#e5989b",
}

cnv = nim.Canvas(figsize=(12.8, 7.2), facecolor="#001219")
bar = nim.Barplot(
    df, "%Y-%m-%d", "3d", post_update=post_update, rounded_edges=True, grid=False
)
bar.add_var(col_var=col)
bar.set_bar_color(bar_cols)
bar.set_title("Sample Title", color="w", weight=600)
bar.set_xlabel("xlabel", color="w")
bar.set_time(
    callback=lambda i, datafier: datafier.data.index[i].strftime("%b, %Y"), color="w"
)
bar.set_text(
    "sum",
    callback=lambda i, datafier: f"Total :{np.round(datafier.data.iloc[i].sum(),2)}",
    size=20,
    x=0.72,
    y=0.20,
    color="w",
)
bar.set_bar_annots(color="w", size=13)
bar.set_xticks(colors="w", length=0, labelsize=13)
bar.set_yticks(colors="w", labelsize=13)
bar.set_bar_border_props(
    edge_color="black", pad=0.1, mutation_aspect=1, radius=0.2, mutation_scale=0.6
)
cnv.add_plot(bar)
cnv.animate()
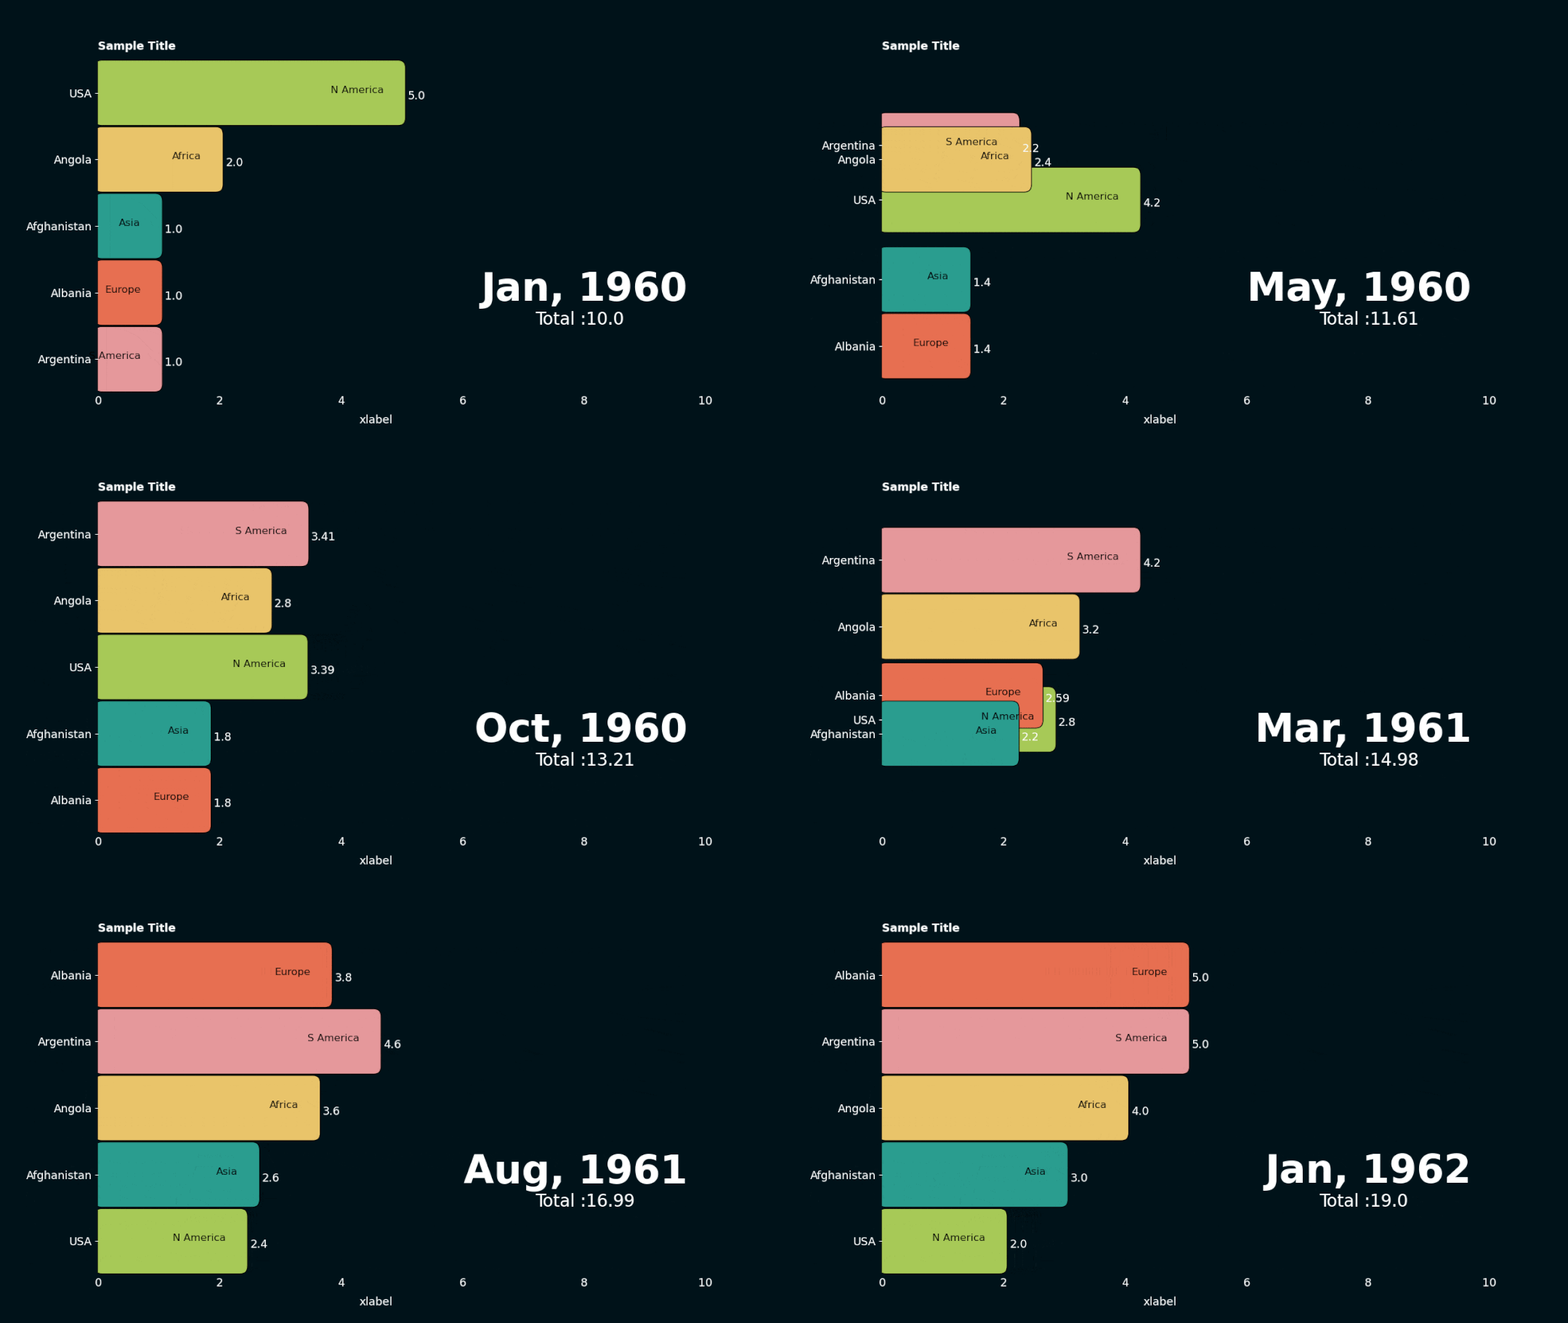
plt.show()위의 동적 막대 차트 효과는 사용자 정의를 통해 더욱 멋져 개발자가 더 많은 플레이 공간을 확보할 수 있습니다. 결과는 다음과 같습니다.

위 내용은 Python을 사용하여 동적 막대 차트를 생성하는 방법의 상세 내용입니다. 자세한 내용은 PHP 중국어 웹사이트의 기타 관련 기사를 참조하세요!

핫 AI 도구

Undresser.AI Undress
사실적인 누드 사진을 만들기 위한 AI 기반 앱

AI Clothes Remover
사진에서 옷을 제거하는 온라인 AI 도구입니다.

Undress AI Tool
무료로 이미지를 벗다

Clothoff.io
AI 옷 제거제

AI Hentai Generator
AI Hentai를 무료로 생성하십시오.

인기 기사

뜨거운 도구

메모장++7.3.1
사용하기 쉬운 무료 코드 편집기

SublimeText3 중국어 버전
중국어 버전, 사용하기 매우 쉽습니다.

스튜디오 13.0.1 보내기
강력한 PHP 통합 개발 환경

드림위버 CS6
시각적 웹 개발 도구

SublimeText3 Mac 버전
신 수준의 코드 편집 소프트웨어(SublimeText3)

뜨거운 주제
 7509
7509
 15
15
 1378
1378
 52
52
 78
78
 11
11
 52
52
 19
19
 19
19
 63
63
 2 시간의 파이썬 계획 : 현실적인 접근
Apr 11, 2025 am 12:04 AM
2 시간 이내에 Python의 기본 프로그래밍 개념과 기술을 배울 수 있습니다. 1. 변수 및 데이터 유형을 배우기, 2. 마스터 제어 흐름 (조건부 명세서 및 루프), 3. 기능의 정의 및 사용을 이해하십시오. 4. 간단한 예제 및 코드 스 니펫을 통해 Python 프로그래밍을 신속하게 시작하십시오.
 파이썬 : 기본 응용 프로그램 탐색
Apr 10, 2025 am 09:41 AM
Python은 웹 개발, 데이터 과학, 기계 학습, 자동화 및 스크립팅 분야에서 널리 사용됩니다. 1) 웹 개발에서 Django 및 Flask 프레임 워크는 개발 프로세스를 단순화합니다. 2) 데이터 과학 및 기계 학습 분야에서 Numpy, Pandas, Scikit-Learn 및 Tensorflow 라이브러리는 강력한 지원을 제공합니다. 3) 자동화 및 스크립팅 측면에서 Python은 자동화 된 테스트 및 시스템 관리와 같은 작업에 적합합니다.
 MongoDB 데이터베이스 비밀번호를 보는 Navicat의 방법
Apr 08, 2025 pm 09:39 PM
해시 값으로 저장되기 때문에 MongoDB 비밀번호를 Navicat을 통해 직접 보는 것은 불가능합니다. 분실 된 비밀번호 검색 방법 : 1. 비밀번호 재설정; 2. 구성 파일 확인 (해시 값이 포함될 수 있음); 3. 코드를 점검하십시오 (암호 하드 코드 메일).
 Amazon Athena와 함께 AWS Glue Crawler를 사용하는 방법
Apr 09, 2025 pm 03:09 PM
데이터 전문가는 다양한 소스에서 많은 양의 데이터를 처리해야합니다. 이것은 데이터 관리 및 분석에 어려움을 겪을 수 있습니다. 다행히도 AWS Glue와 Amazon Athena의 두 가지 AWS 서비스가 도움이 될 수 있습니다.
 Redis로 서버를 시작하는 방법
Apr 10, 2025 pm 08:12 PM
Redis 서버를 시작하는 단계에는 다음이 포함됩니다. 운영 체제에 따라 Redis 설치. Redis-Server (Linux/MacOS) 또는 Redis-Server.exe (Windows)를 통해 Redis 서비스를 시작하십시오. Redis-Cli Ping (Linux/MacOS) 또는 Redis-Cli.exe Ping (Windows) 명령을 사용하여 서비스 상태를 확인하십시오. Redis-Cli, Python 또는 Node.js와 같은 Redis 클라이언트를 사용하여 서버에 액세스하십시오.
 Redis 대기열을 읽는 방법
Apr 10, 2025 pm 10:12 PM
Redis의 대기열을 읽으려면 대기열 이름을 얻고 LPOP 명령을 사용하여 요소를 읽고 빈 큐를 처리해야합니다. 특정 단계는 다음과 같습니다. 대기열 이름 가져 오기 : "큐 :"와 같은 "대기열 : my-queue"의 접두사로 이름을 지정하십시오. LPOP 명령을 사용하십시오. 빈 대기열 처리 : 대기열이 비어 있으면 LPOP이 NIL을 반환하고 요소를 읽기 전에 대기열이 존재하는지 확인할 수 있습니다.
 Redis의 서버 버전을 보는 방법
Apr 10, 2025 pm 01:27 PM
질문 : Redis 서버 버전을 보는 방법은 무엇입니까? 명령 줄 도구 Redis-Cli를 사용하여 연결된 서버의 버전을보십시오. 정보 서버 명령을 사용하여 서버의 내부 버전을보고 정보를 구문 분석하고 반환해야합니다. 클러스터 환경에서 각 노드의 버전 일관성을 확인하고 스크립트를 사용하여 자동으로 확인할 수 있습니다. 스크립트를 사용하여 Python 스크립트와 연결 및 인쇄 버전 정보와 같은보기 버전을 자동화하십시오.
 Navicat의 비밀번호는 얼마나 안전합니까?
Apr 08, 2025 pm 09:24 PM
Navicat의 비밀번호 보안은 대칭 암호화, 암호 강도 및 보안 측정의 조합에 의존합니다. 특정 측정에는 다음이 포함됩니다. SSL 연결 사용 (데이터베이스 서버가 인증서를 지원하고 올바르게 구성하는 경우), 정기적으로 Navicat을 업데이트하고보다 안전한 방법 (예 : SSH 터널), 액세스 권한 제한 및 가장 중요한 것은 암호를 기록하지 않습니다.


