

zabbix로 Nginx/Tomcat/MySQL을 모니터링하는 방법

zabbix监控nginx
a机器:zabbix服务端(192.168.234.128) b机器:zabbix客户端(192.168.234.125)
在b机器(zabbix客户端)操作:
编辑nginx虚拟主机配置文件:
[root@centos ~]# vi /etc/nginx/conf.d/default.conf
在server{}中添加以下内容:
 location /nginx_status
 {
  stub_status on;
  access_log off;
  allow 127.0.0.1;
  deny all;
}重载nginx配置:
[root@centos ~]# nginx -s reload
测试:
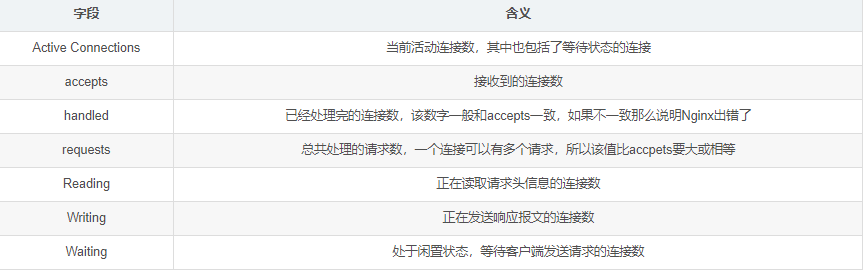
[root@centos ~]# curl http://127.0.0.1/nginx_status
active connections: 1
server accepts handled requests
 3 3 3
reading: 0 writing: 1 waiting: 0
#nginx状态信息已显示
状态说明:
添加监控脚本:
vi /usr/local/sbin/ngx_status.sh
添加以下内容:
#!/bin/bash
url="http://127.0.0.1/nginx_status"
curl=/usr/bin/curl

# 检测nginx进程是否存在
function ping {
 /sbin/pidof nginx | wc -l
}
# 检测nginx性能
function active {
 $curl $url 2>/dev/null| grep 'active' | awk '{print $nf}'
}
function reading {
 $curl $url 2>/dev/null| grep 'reading' | awk '{print $2}'
}
function writing {
 $curl $url 2>/dev/null| grep 'writing' | awk '{print $4}'
}
function waiting {
 $curl $url 2>/dev/null| grep 'waiting' | awk '{print $6}'
}
function accepts {
 $curl $url 2>/dev/null| awk nr==3 | awk '{print $1}'
}
function handled {
 $curl $url 2>/dev/null| awk nr==3 | awk '{print $2}'
}
function requests {
 $curl $url 2>/dev/null| awk nr==3 | awk '{print $3}'
}
$1添加权限:
[root@centos ~]# chmod 755 /usr/local/sbin/ngx_status.sh
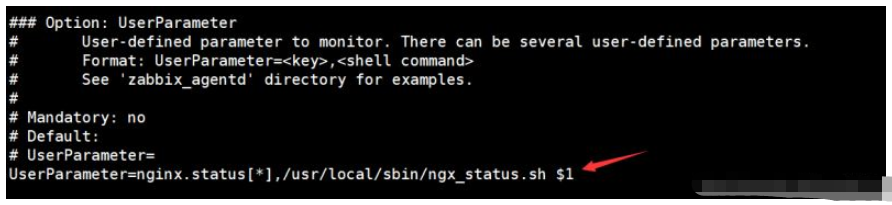
编辑zabbix_agent配置文件:
[root@centos ~]# vi /etc/zabbix/zabbix_agentd.conf
在option:userparameter处添加:userparameter=nginx.status[*],/usr/local/sbin/ngx_status.sh $1
重启服务:
[root@centos ~]# systemctl restart zabbix-agent
在a机器(服务端)测试:
[root@zabbix ~]# zabbix_get -s 192.168.234.125 -k 'nginx.status[accepts]'
6
在本机创建.xml文件并添加以下内容:(文件名称自定义)
<?xml version="1.0" encoding="utf-8"?>
<zabbix_export>
 <version>4.0</version>
 <date>2019-02-11t07:29:29z</date>
 <groups>
  <group>
   <name>templates</name>
  </group>
 </groups>
 <templates>
  <template>
   <template>template app nginx</template>
   <name>template app nginx</name>
   <description/>
   <groups>
    <group>
     <name>templates</name>
    </group>
   </groups>
   <applications>
    <application>
     <name>nginx</name>
    </application>
   </applications>
   <items>
    <item>
     <name>nginx status server accepts</name>
     <type>0</type>
     <snmp_community/>
     <snmp_oid/>
     <key>nginx.status[accepts]</key>
     <delay>60</delay>
     <history>90d</history>
     <trends>365d</trends>
     <status>0</status>
     <value_type>3</value_type>
     <allowed_hosts/>
     <units/>
     <snmpv3_contextname/>
     <snmpv3_securityname/>
     <snmpv3_securitylevel>0</snmpv3_securitylevel>
     <snmpv3_authprotocol>0</snmpv3_authprotocol>
     <snmpv3_authpassphrase/>
     <snmpv3_privprotocol>0</snmpv3_privprotocol>
     <snmpv3_privpassphrase/>
     <params/>
     <ipmi_sensor/>
     <authtype>0</authtype>
     <username/>
     <password/>
     <publickey/>
     <privatekey/>
     <port/>
     <description>accepts</description>
     <inventory_link>0</inventory_link>
     <applications>
      <application>
       <name>nginx</name>
      </application>
     </applications>
     <valuemap/>
     <logtimefmt/>
     <preprocessing>
      <step>
       <type>10</type>
       <params/>
      </step>
     </preprocessing>
     <jmx_endpoint/>
     <timeout>3s</timeout>
     <url/>
     <query_fields/>
     <posts/>
     <status_codes>200</status_codes>
     <follow_redirects>1</follow_redirects>
     <post_type>0</post_type>
     <http_proxy/>
     <headers/>
     <retrieve_mode>0</retrieve_mode>
     <request_method>0</request_method>
     <output_format>0</output_format>
     <allow_traps>0</allow_traps>
     <ssl_cert_file/>
     <ssl_key_file/>
     <ssl_key_password/>
     <verify_peer>0</verify_peer>
     <verify_host>0</verify_host>
     <master_item/>
    </item>
    <item>
     <name>nginx status connections active</name>
     <type>0</type>
     <snmp_community/>
     <snmp_oid/>
     <key>nginx.status[active]</key>
     <delay>60</delay>
     <history>90d</history>
     <trends>365d</trends>
     <status>0</status>
     <value_type>3</value_type>
     <allowed_hosts/>
     <units/>
     <snmpv3_contextname/>
     <snmpv3_securityname/>
     <snmpv3_securitylevel>0</snmpv3_securitylevel>
     <snmpv3_authprotocol>0</snmpv3_authprotocol>
     <snmpv3_authpassphrase/>
     <snmpv3_privprotocol>0</snmpv3_privprotocol>
     <snmpv3_privpassphrase/>
     <params/>
     <ipmi_sensor/>
     <authtype>0</authtype>
     <username/>
     <password/>
     <publickey/>
     <privatekey/>
     <port/>
     <description>active</description>
     <inventory_link>0</inventory_link>
     <applications>
      <application>
       <name>nginx</name>
      </application>
     </applications>
     <valuemap/>
     <logtimefmt/>
     <preprocessing/>
     <jmx_endpoint/>
     <timeout>3s</timeout>
     <url/>
     <query_fields/>
     <posts/>
     <status_codes>200</status_codes>
     <follow_redirects>1</follow_redirects>
     <post_type>0</post_type>
     <http_proxy/>
     <headers/>
     <retrieve_mode>0</retrieve_mode>
     <request_method>0</request_method>
     <output_format>0</output_format>
     <allow_traps>0</allow_traps>
     <ssl_cert_file/>
     <ssl_key_file/>
     <ssl_key_password/>
     <verify_peer>0</verify_peer>
     <verify_host>0</verify_host>
     <master_item/>
    </item>
    <item>
     <name>nginx status server handled</name>
     <type>0</type>
     <snmp_community/>
     <snmp_oid/>
     <key>nginx.status[handled]</key>
     <delay>60</delay>
     <history>90d</history>
     <trends>365d</trends>
     <status>0</status>
     <value_type>3</value_type>
     <allowed_hosts/>
     <units/>
     <snmpv3_contextname/>
     <snmpv3_securityname/>
     <snmpv3_securitylevel>0</snmpv3_securitylevel>
     <snmpv3_authprotocol>0</snmpv3_authprotocol>
     <snmpv3_authpassphrase/>
     <snmpv3_privprotocol>0</snmpv3_privprotocol>
     <snmpv3_privpassphrase/>
     <params/>
     <ipmi_sensor/>
     <authtype>0</authtype>
     <username/>
     <password/>
     <publickey/>
     <privatekey/>
     <port/>
     <description>handled</description>
     <inventory_link>0</inventory_link>
     <applications>
      <application>
       <name>nginx</name>
      </application>
     </applications>
     <valuemap/>
     <logtimefmt/>
     <preprocessing>
      <step>
       <type>10</type>
       <params/>
      </step>
     </preprocessing>
     <jmx_endpoint/>
     <timeout>3s</timeout>
     <url/>
     <query_fields/>
     <posts/>
     <status_codes>200</status_codes>
     <follow_redirects>1</follow_redirects>
     <post_type>0</post_type>
     <http_proxy/>
     <headers/>
     <retrieve_mode>0</retrieve_mode>
     <request_method>0</request_method>
     <output_format>0</output_format>
     <allow_traps>0</allow_traps>
     <ssl_cert_file/>
     <ssl_key_file/>
     <ssl_key_password/>
     <verify_peer>0</verify_peer>
     <verify_host>0</verify_host>
     <master_item/>
    </item>
    <item>
     <name>nginx status ping</name>
     <type>0</type>
     <snmp_community/>
     <snmp_oid/>
     <key>nginx.status[ping]</key>
     <delay>60</delay>
     <history>30d</history>
     <trends>365d</trends>
     <status>0</status>
     <value_type>3</value_type>
     <allowed_hosts/>
     <units/>
     <snmpv3_contextname/>
     <snmpv3_securityname/>
     <snmpv3_securitylevel>0</snmpv3_securitylevel>
     <snmpv3_authprotocol>0</snmpv3_authprotocol>
     <snmpv3_authpassphrase/>
     <snmpv3_privprotocol>0</snmpv3_privprotocol>
     <snmpv3_privpassphrase/>
     <params/>
     <ipmi_sensor/>
     <authtype>0</authtype>
     <username/>
     <password/>
     <publickey/>
     <privatekey/>
     <port/>
     <description>is live</description>
     <inventory_link>0</inventory_link>
     <applications>
      <application>
       <name>nginx</name>
      </application>
     </applications>
     <valuemap>
      <name>service state</name>
     </valuemap>
     <logtimefmt/>
     <preprocessing/>
     <jmx_endpoint/>
     <timeout>3s</timeout>
     <url/>
     <query_fields/>
     <posts/>
     <status_codes>200</status_codes>
     <follow_redirects>1</follow_redirects>
     <post_type>0</post_type>
     <http_proxy/>
     <headers/>
     <retrieve_mode>0</retrieve_mode>
     <request_method>0</request_method>
     <output_format>0</output_format>
     <allow_traps>0</allow_traps>
     <ssl_cert_file/>
     <ssl_key_file/>
     <ssl_key_password/>
     <verify_peer>0</verify_peer>
     <verify_host>0</verify_host>
     <master_item/>
    </item>
    <item>
     <name>nginx status connections reading</name>
     <type>0</type>
     <snmp_community/>
     <snmp_oid/>
     <key>nginx.status[reading]</key>
     <delay>60</delay>
     <history>90d</history>
     <trends>365d</trends>
     <status>0</status>
     <value_type>3</value_type>
     <allowed_hosts/>
     <units/>
     <snmpv3_contextname/>
     <snmpv3_securityname/>
     <snmpv3_securitylevel>0</snmpv3_securitylevel>
     <snmpv3_authprotocol>0</snmpv3_authprotocol>
     <snmpv3_authpassphrase/>
     <snmpv3_privprotocol>0</snmpv3_privprotocol>
     <snmpv3_privpassphrase/>
     <params/>
     <ipmi_sensor/>
     <authtype>0</authtype>
     <username/>
     <password/>
     <publickey/>
     <privatekey/>
     <port/>
     <description>reading</description>
     <inventory_link>0</inventory_link>
     <applications>
      <application>
       <name>nginx</name>
      </application>
     </applications>
     <valuemap/>
     <logtimefmt/>
     <preprocessing/>
     <jmx_endpoint/>
     <timeout>3s</timeout>
     <url/>
     <query_fields/>
     <posts/>
     <status_codes>200</status_codes>
     <follow_redirects>1</follow_redirects>
     <post_type>0</post_type>
     <http_proxy/>
     <headers/>
     <retrieve_mode>0</retrieve_mode>
     <request_method>0</request_method>
     <output_format>0</output_format>
     <allow_traps>0</allow_traps>
     <ssl_cert_file/>
     <ssl_key_file/>
     <ssl_key_password/>
     <verify_peer>0</verify_peer>
     <verify_host>0</verify_host>
     <master_item/>
    </item>
    <item>
     <name>nginx status server requests</name>
     <type>0</type>
     <snmp_community/>
     <snmp_oid/>
     <key>nginx.status[requests]</key>
     <delay>60</delay>
     <history>90d</history>
     <trends>365d</trends>
     <status>0</status>
     <value_type>3</value_type>
     <allowed_hosts/>
     <units/>
     <snmpv3_contextname/>
     <snmpv3_securityname/>
     <snmpv3_securitylevel>0</snmpv3_securitylevel>
     <snmpv3_authprotocol>0</snmpv3_authprotocol>
     <snmpv3_authpassphrase/>
     <snmpv3_privprotocol>0</snmpv3_privprotocol>
     <snmpv3_privpassphrase/>
     <params/>
     <ipmi_sensor/>
     <authtype>0</authtype>
     <username/>
     <password/>
     <publickey/>
     <privatekey/>
     <port/>
     <description>requests</description>
     <inventory_link>0</inventory_link>
     <applications>
      <application>
       <name>nginx</name>
      </application>
     </applications>
     <valuemap/>
     <logtimefmt/>
     <preprocessing>
      <step>
       <type>10</type>
       <params/>
      </step>
     </preprocessing>
     <jmx_endpoint/>
     <timeout>3s</timeout>
     <url/>
     <query_fields/>
     <posts/>
     <status_codes>200</status_codes>
     <follow_redirects>1</follow_redirects>
     <post_type>0</post_type>
     <http_proxy/>
     <headers/>
     <retrieve_mode>0</retrieve_mode>
     <request_method>0</request_method>
     <output_format>0</output_format>
     <allow_traps>0</allow_traps>
     <ssl_cert_file/>
     <ssl_key_file/>
     <ssl_key_password/>
     <verify_peer>0</verify_peer>
     <verify_host>0</verify_host>
     <master_item/>
    </item>
    <item>
     <name>nginx status connections waiting</name>
     <type>0</type>
     <snmp_community/>
     <snmp_oid/>
     <key>nginx.status[waiting]</key>
     <delay>60</delay>
     <history>90d</history>
     <trends>365d</trends>
     <status>0</status>
     <value_type>3</value_type>
     <allowed_hosts/>
     <units/>
     <snmpv3_contextname/>
     <snmpv3_securityname/>
     <snmpv3_securitylevel>0</snmpv3_securitylevel>
     <snmpv3_authprotocol>0</snmpv3_authprotocol>
     <snmpv3_authpassphrase/>
     <snmpv3_privprotocol>0</snmpv3_privprotocol>
     <snmpv3_privpassphrase/>
     <params/>
     <ipmi_sensor/>
     <authtype>0</authtype>
     <username/>
     <password/>
     <publickey/>
     <privatekey/>
     <port/>
     <description>waiting</description>
     <inventory_link>0</inventory_link>
     <applications>
      <application>
       <name>nginx</name>
      </application>
     </applications>
     <valuemap/>
     <logtimefmt/>
     <preprocessing/>
     <jmx_endpoint/>
     <timeout>3s</timeout>
     <url/>
     <query_fields/>
     <posts/>
     <status_codes>200</status_codes>
     <follow_redirects>1</follow_redirects>
     <post_type>0</post_type>
     <http_proxy/>
     <headers/>
     <retrieve_mode>0</retrieve_mode>
     <request_method>0</request_method>
     <output_format>0</output_format>
     <allow_traps>0</allow_traps>
     <ssl_cert_file/>
     <ssl_key_file/>
     <ssl_key_password/>
     <verify_peer>0</verify_peer>
     <verify_host>0</verify_host>
     <master_item/>
    </item>
    <item>
     <name>nginx status connections writing</name>
     <type>0</type>
     <snmp_community/>
     <snmp_oid/>
     <key>nginx.status[writing]</key>
     <delay>60</delay>
     <history>90d</history>
     <trends>365d</trends>
     <status>0</status>
     <value_type>3</value_type>
     <allowed_hosts/>
     <units/>
     <snmpv3_contextname/>
     <snmpv3_securityname/>
     <snmpv3_securitylevel>0</snmpv3_securitylevel>
     <snmpv3_authprotocol>0</snmpv3_authprotocol>
     <snmpv3_authpassphrase/>
     <snmpv3_privprotocol>0</snmpv3_privprotocol>
     <snmpv3_privpassphrase/>
     <params/>
     <ipmi_sensor/>
     <authtype>0</authtype>
     <username/>
     <password/>
     <publickey/>
     <privatekey/>
     <port/>
     <description>writing</description>
     <inventory_link>0</inventory_link>
     <applications>
      <application>
       <name>nginx</name>
      </application>
     </applications>
     <valuemap/>
     <logtimefmt/>
     <preprocessing/>
     <jmx_endpoint/>
     <timeout>3s</timeout>
     <url/>
     <query_fields/>
     <posts/>
     <status_codes>200</status_codes>
     <follow_redirects>1</follow_redirects>
     <post_type>0</post_type>
     <http_proxy/>
     <headers/>
     <retrieve_mode>0</retrieve_mode>
     <request_method>0</request_method>
     <output_format>0</output_format>
     <allow_traps>0</allow_traps>
     <ssl_cert_file/>
     <ssl_key_file/>
     <ssl_key_password/>
     <verify_peer>0</verify_peer>
     <verify_host>0</verify_host>
     <master_item/>
    </item>
   </items>
   <discovery_rules/>
   <httptests/>
   <macros/>
   <templates/>
   <screens/>
  </template>
 </templates>
 <triggers>
  <trigger>
   <expression>{template app nginx:nginx.status[ping].last()}=0</expression>
   <recovery_mode>0</recovery_mode>
   <recovery_expression/>
   <name>nginx was down!</name>
   <correlation_mode>0</correlation_mode>
   <correlation_tag/>
   <url/>
   <status>0</status>
   <priority>4</priority>
   <description>nginx进程数:0,请注意</description>
   <type>0</type>
   <manual_close>0</manual_close>
   <dependencies/>
   <tags/>
  </trigger>
 </triggers>
 <graphs>
  <graph>
   <name>nginx status connections</name>
   <width>900</width>
   <height>200</height>
   <yaxismin>0.0000</yaxismin>
   <yaxismax>100.0000</yaxismax>
   <show_work_period>1</show_work_period>
   <show_triggers>1</show_triggers>
   <type>0</type>
   <show_legend>1</show_legend>
   <show_3d>0</show_3d>
   <percent_left>0.0000</percent_left>
   <percent_right>0.0000</percent_right>
   <ymin_type_1>0</ymin_type_1>
   <ymax_type_1>0</ymax_type_1>
   <ymin_item_1>0</ymin_item_1>
   <ymax_item_1>0</ymax_item_1>
   <graph_items>
    <graph_item>
     <sortorder>0</sortorder>
     <drawtype>0</drawtype>
     <color>00c800</color>
     <yaxisside>0</yaxisside>
     <calc_fnc>2</calc_fnc>
     <type>0</type>
     <item>
      <host>template app nginx</host>
      <key>nginx.status[active]</key>
     </item>
    </graph_item>
    <graph_item>
     <sortorder>1</sortorder>
     <drawtype>0</drawtype>
     <color>c80000</color>
     <yaxisside>0</yaxisside>
     <calc_fnc>2</calc_fnc>
     <type>0</type>
     <item>
      <host>template app nginx</host>
      <key>nginx.status[reading]</key>
     </item>
    </graph_item>
    <graph_item>
     <sortorder>2</sortorder>
     <drawtype>0</drawtype>
     <color>0000c8</color>
     <yaxisside>0</yaxisside>
     <calc_fnc>2</calc_fnc>
     <type>0</type>
     <item>
      <host>template app nginx</host>
      <key>nginx.status[waiting]</key>
     </item>
    </graph_item>
    <graph_item>
     <sortorder>3</sortorder>
     <drawtype>0</drawtype>
     <color>c800c8</color>
     <yaxisside>0</yaxisside>
     <calc_fnc>2</calc_fnc>
     <type>0</type>
     <item>
      <host>template app nginx</host>
      <key>nginx.status[writing]</key>
     </item>
    </graph_item>
   </graph_items>
  </graph>
  <graph>
   <name>nginx status server</name>
   <width>900</width>
   <height>200</height>
   <yaxismin>0.0000</yaxismin>
   <yaxismax>100.0000</yaxismax>
   <show_work_period>1</show_work_period>
   <show_triggers>1</show_triggers>
   <type>0</type>
   <show_legend>1</show_legend>
   <show_3d>0</show_3d>
   <percent_left>0.0000</percent_left>
   <percent_right>0.0000</percent_right>
   <ymin_type_1>0</ymin_type_1>
   <ymax_type_1>0</ymax_type_1>
   <ymin_item_1>0</ymin_item_1>
   <ymax_item_1>0</ymax_item_1>
   <graph_items>
    <graph_item>
     <sortorder>0</sortorder>
     <drawtype>0</drawtype>
     <color>00c800</color>
     <yaxisside>0</yaxisside>
     <calc_fnc>2</calc_fnc>
     <type>0</type>
     <item>
      <host>template app nginx</host>
      <key>nginx.status[accepts]</key>
     </item>
    </graph_item>
    <graph_item>
     <sortorder>1</sortorder>
     <drawtype>0</drawtype>
     <color>c80000</color>
     <yaxisside>0</yaxisside>
     <calc_fnc>2</calc_fnc>
     <type>0</type>
     <item>
      <host>template app nginx</host>
      <key>nginx.status[handled]</key>
     </item>
    </graph_item>
    <graph_item>
     <sortorder>2</sortorder>
     <drawtype>0</drawtype>
     <color>0000c8</color>
     <yaxisside>0</yaxisside>
     <calc_fnc>2</calc_fnc>
     <type>0</type>
     <item>
      <host>template app nginx</host>
      <key>nginx.status[requests]</key>
     </item>
    </graph_item>
   </graph_items>
  </graph>
 </graphs>
 <value_maps>
  <value_map>
   <name>service state</name>
   <mappings>
    <mapping>
     <value>0</value>
     <newvalue>down</newvalue>
    </mapping>
    <mapping>
     <value>1</value>
     <newvalue>up</newvalue>
    </mapping>
   </mappings>
  </value_map>
 </value_maps>
</zabbix_export>在zabbix前端页面点击配置→模板→导入:
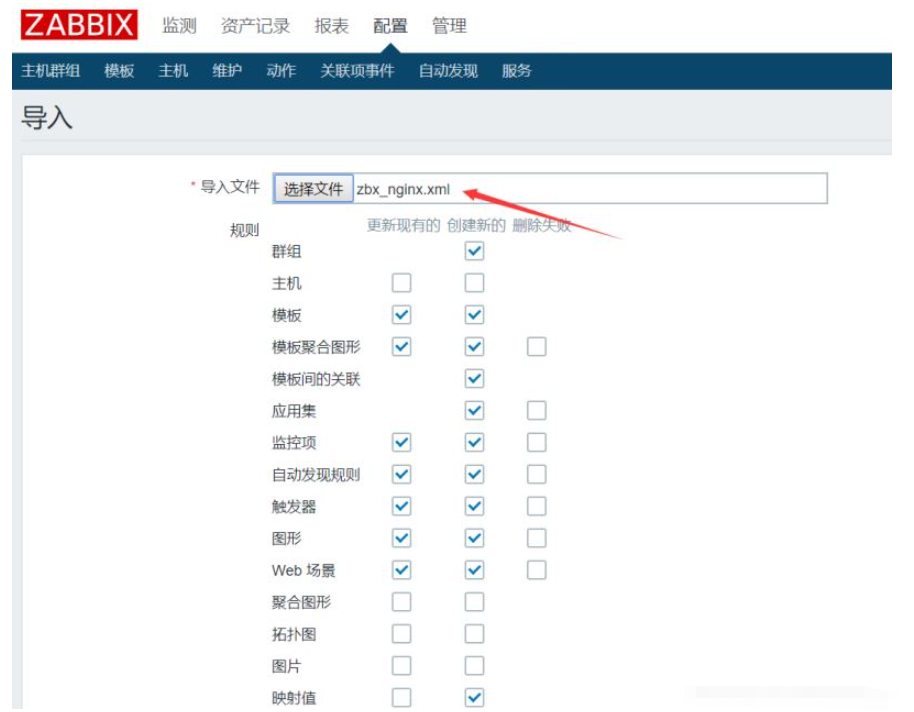
#导入刚才创建的xml文件即可
导入成功后在主机列表页面选择被监控的机器(b机器)链接该模板即可开始监控nginx
zabbix监控tomcat
a机器:zabbix服务端(192.168.234.128) b机器:zabbix客户端(192.168.234.125)
在a机器安装zabbix-java-gateway:
[root@zabbix ~]# wget https://mirrors.tuna.tsinghua.edu.cn/zabbix/zabbix/4.0/rhel/7/x86_64/zabbix-java-gateway-4.0.14-1.el7.x86_64.rpm

[root@zabbix ~]# yum -y localinstall zabbix-java-gateway-4.0.14-1.el7.x86_64.rpm
编辑gateway配置文件:
[root@zabbix ~]# vi /etc/zabbix/zabbix_java_gateway.conf
去掉listen_ip、listen_port(监听端口)、start_pollers(进程数)的注释符号#:
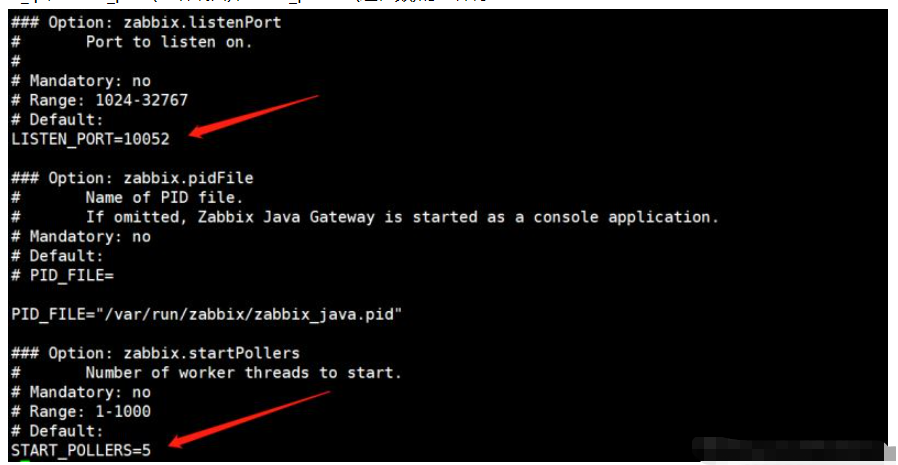
#listen_ip定义被监控机器的地址,不指定默认监听全部机器
编辑server配置文件:
[root@zabbix ~]# vi /etc/zabbix/zabbix_server.conf
定义以下3个配置参数:
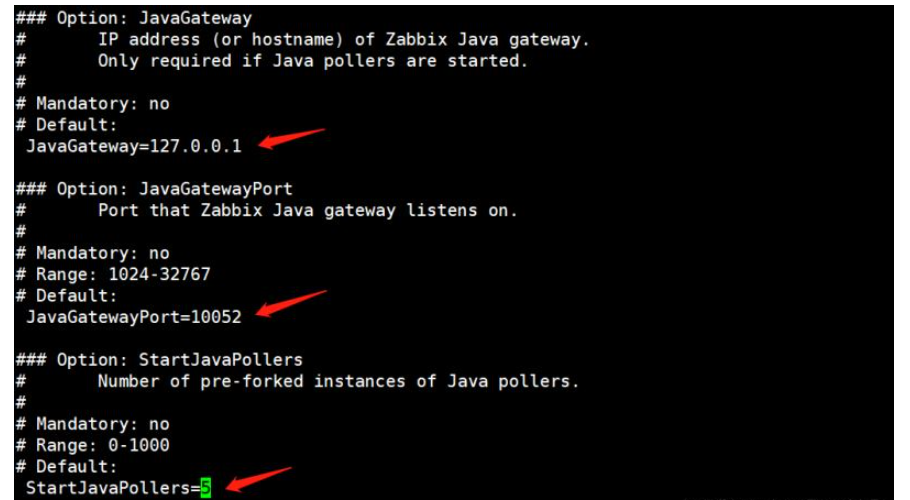
启动zabbix-java-gateway服务:
[root@zabbix ~]# systemctl start zabbix-java-gateway
重启zabbix-server服务:
[root@zabbix ~]# systemctl restart zabbix-server
查看监听端口:
[root@zabbix ~]# netstat -lntp |grep java
tcp6  0  0 :::10052    :::*     listen  8706/java
开启jmx
在b机器编辑tomcat配置文件:
[root@centos ~]# vi /usr/local/tomcat/bin/catalina.sh
添加以下内容:
export catalina_opts="$catalina_opts -dcom.sun.management.jmxremote
-djava.rmi.server.hostname=192.168.234.125
-dcom.sun.management.jmxremote.port=9999
-dcom.sun.management.jmxremote.ssl=false
-dcom.sun.management.jmxremote.authenticate=false"
#hostname定义b机器地址,端口9999(默认12345)
重启tomcat:
[root@centos ~]# /usr/local/tomcat/bin/shutdown.sh

[root@centos ~]# /usr/local/tomcat/bin/startup.sh
查看监听端口9999:
[root@centos ~]# netstat -lntp |grep 9999
tcp6  0  0 :::9999     :::*     listen  25861/java
进入zabbix前端页面添加主机:
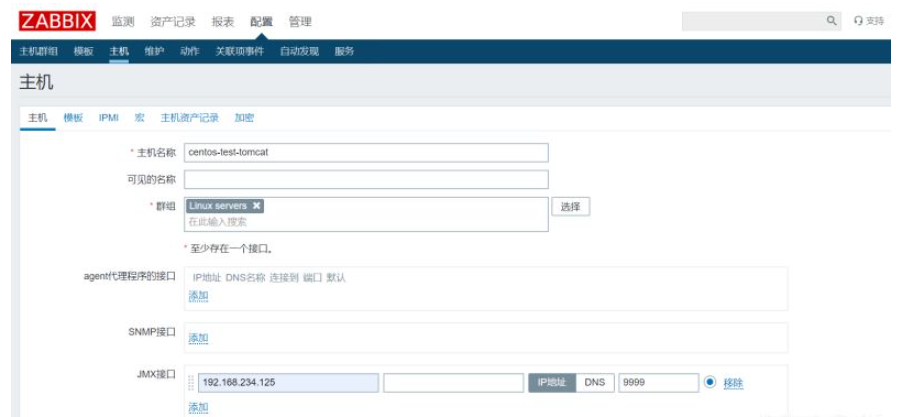
#与普通情况添加监控主机不同,监控b机器的tomcat需要配置jmx接口
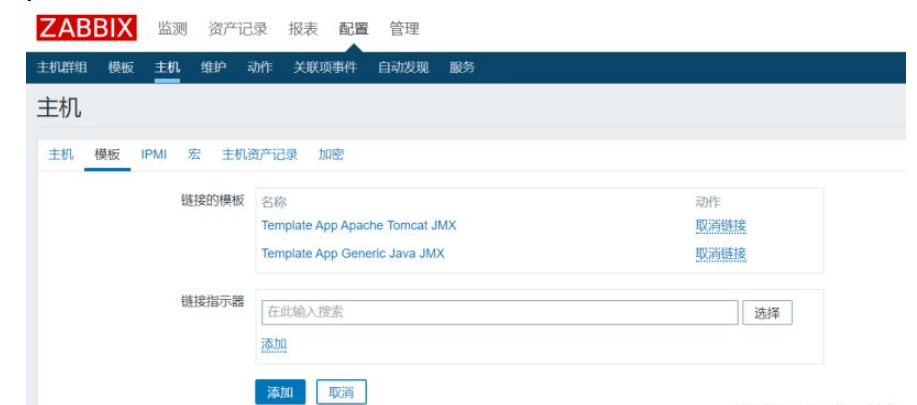
模板链接jmx相关的两个模板:
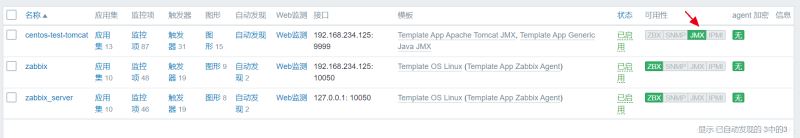
当jmx图标变绿即表示配置成功:
zabbix监控mysql
a机器:zabbix服务端(192.168.234.128) b机器:zabbix客户端(192.168.234.125)
zabbix_agent定义mysql监控的配置文件:/etc/zabbix/zabbix_agentd.d/userparameter_mysql.conf
在b机器登录mysql创建用户:
mysql> grant usage,process,replication client on *.* to zamysql@'localhost' identified by 'zamysql';
创建配置文件指定的目录:
[root@centos ~]# mkdir /var/lib/zabbix
创建my.cnf文件:
[root@centos ~]# vi /var/lib/zabbix/.my.cnf
#需要注意该文件是隐藏文件
添加以下内容:
[mysql]
host=localhost
user=zamysql
password='zamysql'
socket=/tmp/mysql.sock

[mysqladmin]
host=localhost
user=zamysql
password='zamysql'
socket=/tmp/mysql.sock
在a机器测试:
[root@zabbix ~]# zabbix_get -s 192.168.234.125 -p 10050 -k mysql.ping
1
[root@zabbix ~]# zabbix_get -s 192.168.234.125 -p 10050 -k mysql.version
mysql ver 14.14 distrib 5.6.43, for linux-glibc2.12 (x86_64) using editline wrapper
[root@zabbix ~]# zabbix_get -s 192.168.234.125 -p 10050 -k mysql.size
10240
#已成功获取数据
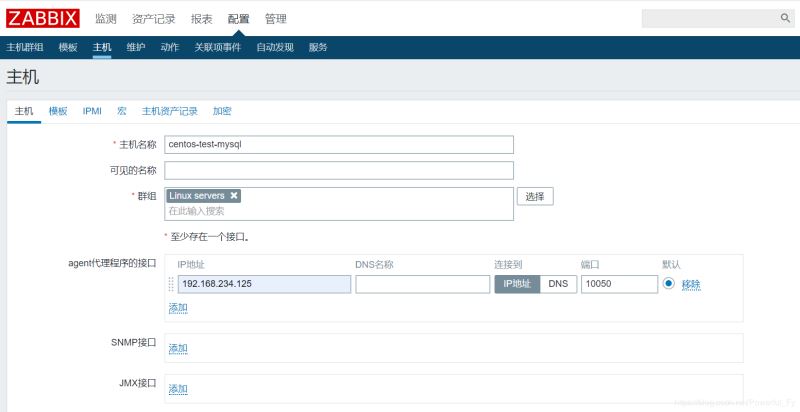
在zabbix前端页面添加主机:
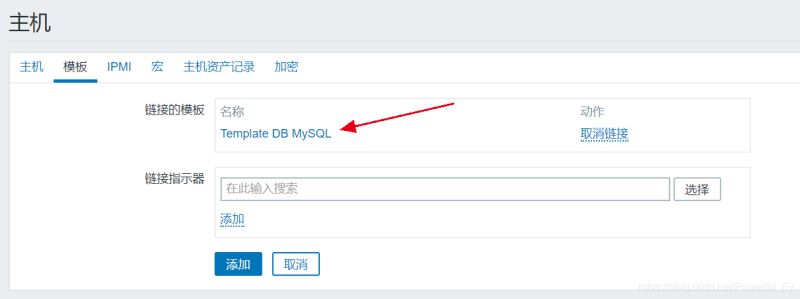
监控模板选择db mysql:
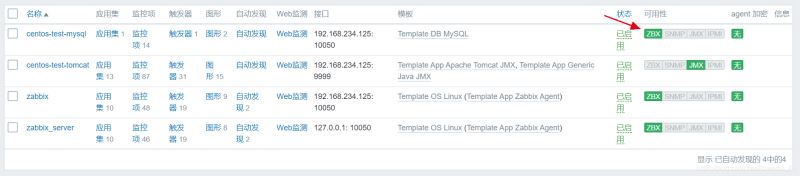
zbx标准变为绿色表示成功:
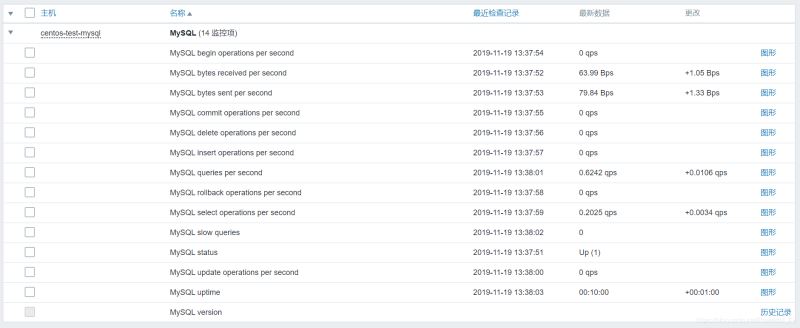
在监测→最新数据页面即可查看mysql监控数据:
위 내용은 zabbix로 Nginx/Tomcat/MySQL을 모니터링하는 방법의 상세 내용입니다. 자세한 내용은 PHP 중국어 웹사이트의 기타 관련 기사를 참조하세요!

핫 AI 도구

Undresser.AI Undress
사실적인 누드 사진을 만들기 위한 AI 기반 앱

AI Clothes Remover
사진에서 옷을 제거하는 온라인 AI 도구입니다.

Undress AI Tool
무료로 이미지를 벗다

Clothoff.io
AI 옷 제거제

AI Hentai Generator
AI Hentai를 무료로 생성하십시오.

인기 기사
뜨거운 도구

메모장++7.3.1
사용하기 쉬운 무료 코드 편집기

SublimeText3 중국어 버전
중국어 버전, 사용하기 매우 쉽습니다.

스튜디오 13.0.1 보내기
강력한 PHP 통합 개발 환경

드림위버 CS6
시각적 웹 개발 도구

SublimeText3 Mac 버전
신 수준의 코드 편집 소프트웨어(SublimeText3)
뜨거운 주제
 7450
7450
 15
1374
52
77
11
40
19
14
8
15
1374
52
77
11
40
19
14
8

 Tomcat에 여러 프로젝트를 배포하는 방법
Apr 21, 2024 am 09:33 AM
Tomcat에 여러 프로젝트를 배포하는 방법
Apr 21, 2024 am 09:33 AM
Tomcat을 통해 여러 프로젝트를 배포하려면 각 프로젝트에 대한 webapp 디렉터리를 생성한 후 다음을 수행해야 합니다. 자동 배포: webapp 디렉터리를 Tomcat의 webapps 디렉터리에 배치합니다. 수동 배포: Tomcat의 관리자 애플리케이션에서 프로젝트를 수동으로 배포합니다. 프로젝트가 배포되면 해당 배포 이름(예: http://localhost:8080/project1)으로 액세스할 수 있습니다.
 Tomcat 웹사이트의 루트 디렉터리는 어디에 있나요?
Apr 21, 2024 am 09:27 AM
Tomcat 웹사이트의 루트 디렉터리는 어디에 있나요?
Apr 21, 2024 am 09:27 AM
Tomcat 웹사이트 루트 디렉터리는 Tomcat의 webapps 하위 디렉터리에 있으며 웹 애플리케이션 파일, 정적 리소스 및 WEB-INF 디렉터리를 저장하는 데 사용됩니다. Tomcat 구성 파일에서 docBase 속성을 찾아 찾을 수 있습니다.
 Tomcat에서 도메인 이름을 구성하는 방법
Apr 21, 2024 am 09:52 AM
Tomcat에서 도메인 이름을 구성하는 방법
Apr 21, 2024 am 09:52 AM
도메인 이름을 사용하도록 Tomcat을 구성하려면 다음 단계를 수행하십시오. server.xml 백업을 생성하십시오. server.xml을 열고 Host 요소를 추가하고 example.com을 도메인 이름으로 바꿉니다. 도메인 이름에 대한 SSL 인증서를 생성합니다(필요한 경우). server.xml에 SSL 커넥터를 추가하고 포트, 키 저장소 파일 및 비밀번호를 변경하십시오. server.xml을 저장합니다. 톰캣을 다시 시작하세요.
 HTML 파일에서 URL을 생성하는 방법
Apr 21, 2024 pm 12:57 PM
HTML 파일에서 URL을 생성하는 방법
Apr 21, 2024 pm 12:57 PM
HTML 파일을 URL로 변환하려면 다음 단계를 포함하는 웹 서버가 필요합니다. 웹 서버를 얻습니다. 웹 서버를 설정합니다. HTML 파일을 업로드하세요. 도메인 이름을 만듭니다. 요청을 라우팅합니다.
 Tomcat에서 문자가 왜곡되는 이유
Apr 21, 2024 am 10:18 AM
Tomcat에서 문자가 왜곡되는 이유
Apr 21, 2024 am 10:18 AM
Tomcat 문자가 왜곡되는 이유: 1. 문자 집합 불일치, 2. HTTP 응답 헤더가 올바르게 설정되지 않음, 3. 필터 또는 인코더 구성 오류, 4. 웹 페이지 인코딩이 잘못됨, 5. 기타 이유(서버 측 언어, 데이터베이스 포함) 인코딩 및 프록시 서버 문제).
 Eclipse에서 서버를 추가하는 방법
May 05, 2024 pm 07:27 PM
Eclipse에서 서버를 추가하는 방법
May 05, 2024 pm 07:27 PM
Eclipse에 서버를 추가하려면 다음 단계를 수행하십시오. 서버 런타임 환경 생성 서버 구성 서버 인스턴스 생성 서버 런타임 환경 선택 서버 인스턴스 구성 서버 배포 프로젝트 시작
 Tomcat 최대 연결 수 및 최대 스레드 수
Apr 21, 2024 am 09:22 AM
Tomcat 최대 연결 수 및 최대 스레드 수
Apr 21, 2024 am 09:22 AM
최대 Tomcat 연결 수는 동시에 연결되는 클라이언트 수를 제한하고, 최대 스레드 수는 동시에 요청을 처리할 수 있는 스레드 수를 제한합니다. 이러한 제한은 서버 리소스 고갈을 방지하고 서버 용량 및 로드와 일치하도록 server.xml의 maxConnections 및 maxThreads 속성을 설정하여 구성됩니다.
 PHP를 사용하여 웹사이트를 배포하고 유지하는 방법
May 03, 2024 am 08:54 AM
PHP를 사용하여 웹사이트를 배포하고 유지하는 방법
May 03, 2024 am 08:54 AM
PHP 웹 사이트를 성공적으로 배포하고 유지하려면 다음 단계를 수행해야 합니다. 웹 서버(예: Apache 또는 Nginx) 선택 PHP 설치 데이터베이스 생성 및 PHP 연결 서버에 코드 업로드 도메인 이름 및 DNS 모니터링 웹 사이트 유지 관리 설정 단계에는 PHP 및 웹 서버 업데이트, 웹 사이트 백업, 오류 로그 모니터링 및 콘텐츠 업데이트가 포함됩니다.
