Python folium의 기능을 사용하는 방법
1. 렌더링
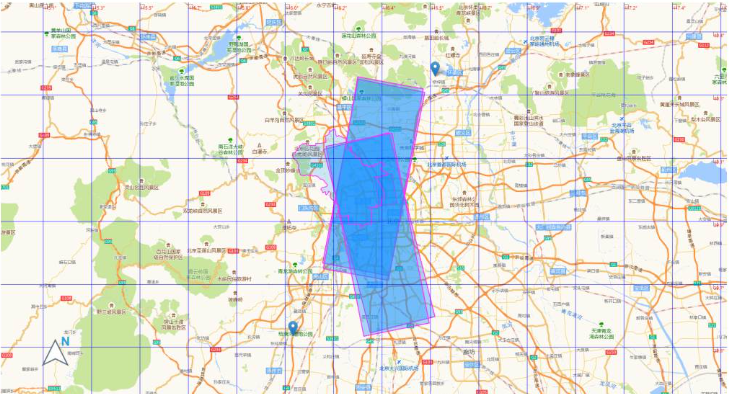
2. 레이어 제어
Folium 공식은 또한 우리가 사용할 수 있는 몇 가지 명확한 방법을 제공합니다. 레이어 제어와 같습니다. 공식 메서드 이름은 FeatureGroup이고 가져오기 메서드는 folium import FeatureGroup 또는 folium.FeatureGroup()에서 가져옵니다. 여기서는 구체적인 원리에 대해 자세히 설명하지 않고 주로 예를 살펴보겠습니다.
import folium
def map2png(map_data,out_file='pdf.png'):
# 1.直接构造,默认底图
mo = folium.Map(location=[0, 0])
# 2.图层1-高德底图+数据
fg = folium.FeatureGroup()
# 2.1 高德地图
fg.add_child(folium.TileLayer(
tiles='http://webrd02.is.autonavi.com/appmaptile?lang=zh_cn&size=1&scale=1&style=8&x={x}&y={y}&z={z}',
attr="© <a href=http://ditu.amap.com/>高德地图</a>",
min_zoom=0,
max_zoom=19,
control=True,
zoom_control=False,
show=True))
# 2.2添加一个点
fg.add_child(folium.Marker(
location=[45.3311, -121.7113],
popup="Timberline Lodge",
icon=folium.Icon(color="green")))
# 2.3添加一个线形
fg.add_child(folium.PolyLine(
locations=[[38.68,115.67],
[38.85,115.48],
[38.65,115.37],
[38.68,115.67]],
color='green', weight=2, opacity=1))
# 2.4添加一个面
fg.add_child(folium.Polygon(
locations=[[38.68,115.67],
[38.85,115.48],
[38.65,115.37],
[38.68,115.67]],
color='green', weight=2,
fill=True,fill_color = 'red'))
# 2.5将我们的图层加入map
mo.add_child(fg)
# 3.图层2-重点数据+最上层
fg2 = folium.FeatureGroup()
fg2.add_child(folium.Polygon(
locations=[[38.68,115.67],
[38.85,115.48],
[38.65,115.37],
[38.68,115.67]],
color='green', weight=2,
fill=True,fill_color = 'red'))
mo.add_child(fg2)
# 4.将图层fg2显示在最上层,keep_in_front的参数必须是FeatureGroup或TileLayer对象
mo.keep_in_front(fg2)
# 5.根据范围缩放地图
mo.fit_bounds([[38.68,115.67],
[38.85,115.48],
[38.65,115.37],
[38.68,115.67]])
root = mo.get_root()
html = root.render() # 这个拿到的就是一个html的内容
# mo.save('text.html')3. 북쪽 포인터
북쪽 포인터 기능은 지도에 반드시 필요한 것은 아니지만 항상 추가하는 것이 좋습니다. 공식 문서 및 소스 코드 분석에는 관련 내용이 언급되어 있지 않지만 FloatImage를 사용하면 이 기능을 수행할 수 있습니다. 공식 문서에는 많은 플러그인이 제공되어 있으며, 그 중 가장 널리 사용되는 것은 히트맵이라는 HeatMap 방법입니다.
FloatImage 메서드는 화면에 이미지를 배치하고 이미지의 크기와 화면의 위치를 지정하는 것을 구현합니다. 매개변수는 정수입니다(FloatImage 메서드는 백분율 변환을 구현합니다). 두 번째 코드를 기반으로 왼쪽 하단에 이미지를 추가했습니다.
fg.add_child(FloatImage(os.path.join(base, 'map_png', 'image', 'compass.png'), left=5, bottom=10, width=5))
4. folium에 js 및 css 추가
folium은 공식적으로 js 및 css를 추가하는 관련 메소드를 제공하지 않습니다. 인터넷에 있는 많은 메소드는 소스 코드 해석을 기반으로 추출되어야 하며 상대적으로 간단하며 구체적인 지침이 없습니다. . 관련 지침을 보려면 js 및 css를 추가하세요.
Folium의 지도 기능은 jinjia2를 통해 구현되어 데이터 및 지도용 HTML을 로드하는 것을 소스 코드에서 알 수 있습니다.
소스코드에 사용되는 데이터와 지도를 추가하는 방법은 크게 3가지가 있습니다. 이러한 방법에는 결함이 있습니다(앞에만 추가할 수 있음). 이러한 방법은 대부분의 시나리오에서 사용할 수 있습니다. 맵 개체에 대한 작업이 포함되지 않으면 이 세 가지 방법이 요구 사항을 충족할 수 있습니다.
1.header는 js 및 css를 추가합니다
    init_script = """
        var mapsPlaceholder = [];
        L.Map.addInitHook(function () {mapsPlaceholder.push(this);});
    """
    # 加在header最上边
    mo.get_root().header.add_child(folium.Element(init_script))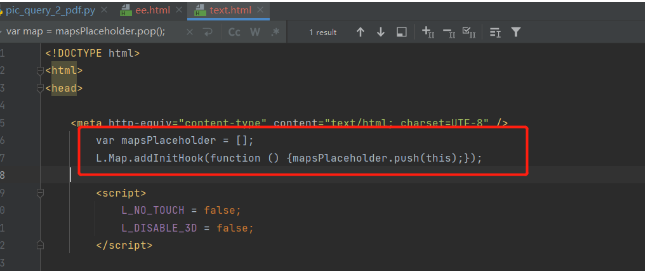
2.body는 js 및 css를 추가합니다
    init_script = """
        var mapsPlaceholder = [];
        L.Map.addInitHook(function () {mapsPlaceholder.push(this);});
    """
    # 加在body中
    mo.get_root().html.add_child(folium.Element(init_script))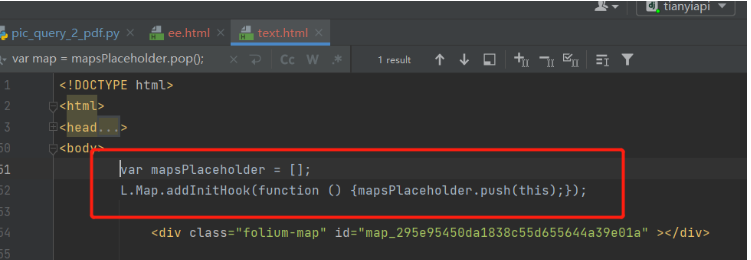
3.script는 js 및 css
    init_script = """
        var mapsPlaceholder = [];
        L.Map.addInitHook(function () {mapsPlaceholder.push(this);});
    """
    # 加在script中
    mo.get_root().script.add_child(folium.Element(init_script))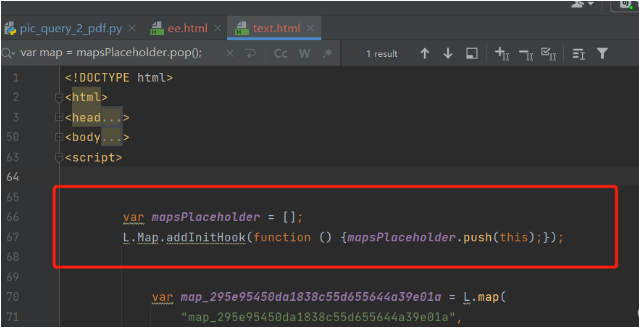
5를 추가합니다.
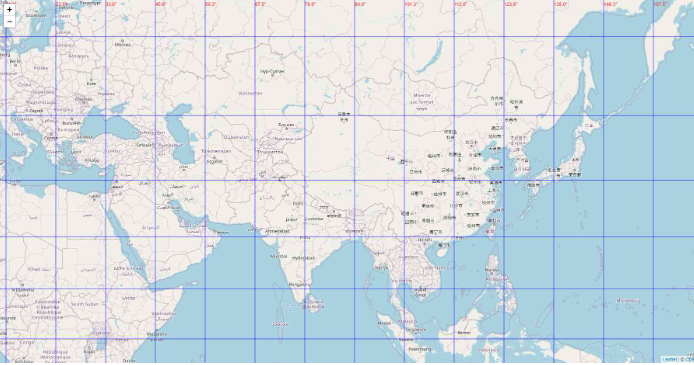
Up 한 단계에서는 html 파일의 서로 다른 위치에 js와 css를 추가하는 방법이 구현됩니다. 지도 객체의 작업과 관련된 경우 경도 및 위도 격자선이 추가되는 등 만족스럽지 못한 상황이 발생할 수 있습니다. 위도 및 경도 격자선 기능을 구현하는 것이 번거롭습니다. 1. 공식적인 관련 방법 및 플러그인이 없습니다(현재 없음). 2. 위도와 경도를 구현하기 위해 Leadlet.js를 사용하는 라이브러리입니다. 전단지에 대해 잘 알고 있어야 합니다. (인터넷에서 관련 기사가 하나만 발견되었습니다.) 3 위 기사는 프런트 엔드로 완성되었습니다. 직접 백엔드 구현 방법. 4. 프론트엔드 구현 방식은 지도를 직접 생성하는 방식입니다. 여기서는 지도 생성 객체를 사용할 수 없습니다(지도 객체는 무작위로 생성됩니다). 위도와 경도 격자선을 결정하는 방법은 무엇입니까? 지도 객체를 생성할 때 객체를 저장한 다음 지도 객체를 가져와 확대/축소 수준에 따라 그리드 선을 구현해야 합니다. 중요한 작업은 지도 객체를 생성하기 전후에 JavaScript 코드가 HTML 페이지에 올바르게 삽입되었는지 확인하는 것입니다. 그 중 맵 객체 생성 시 객체를 4개로 저장하는 방식을 구현했습니다. Folium 소스 코드를 연구하여 맵 객체 생성 후 j를 추가하도록 js를 추가하는 방법을 다시 작성했습니다.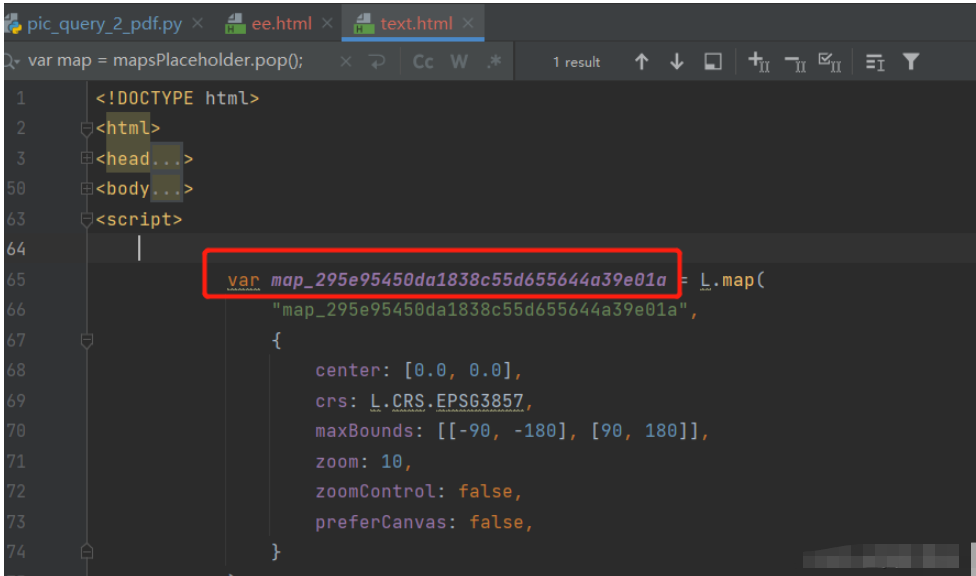
<!DOCTYPE html>
<html lang="en">
<head>
<meta charset="UTF-8" />
<meta http-equiv="X-UA-Compatible" content="IE=edge" />
<meta name="viewport" content="width=device-width, initial-scale=1.0" />
<link
rel="stylesheet"
href="https://unpkg.com/leaflet@1.7.1/dist/leaflet.css" rel="external nofollow"
/>
<script src="https://unpkg.com/leaflet@1.7.1/dist/leaflet.js"></script>
<title>leaflet-经纬网格</title>
<style>
html,
body {
width: 100%;
height: 100%;
padding: 0;
margin: 0;
}
.leaflet-div-icon {
background: none;
border: none;
}
</style>
</head>
<body>
<div id="map" ></div>
<script>
let map = L.map("map", { renderer: L.canvas({ padding: 0.5 }) }).setView(
[25.127879288597576, 118.37905883789064],
4
);
// 添加背景图层
L.tileLayer("https://{s}.tile.openstreetmap.org/{z}/{x}/{y}.png", {
attribution:
'© <a href="https://www.openstreetmap.org/copyright" rel="external nofollow" >OpenStreetMap</a> contributors',
}).addTo(map);
// 创建图层
let lonLatGridLineLayer = L.featureGroup().addTo(map);
// 经纬网格生成方法
let addLonLatLine = () => {
let zoom = map.getZoom();
let bounds = map.getBounds();
let north = bounds.getNorth();
let east = bounds.getEast();
// 经纬度间隔
let d = 90 / Math.pow(2, zoom - 1);
// 经线网格
for (let index = -180; index <= 360; index += d) {
// 判断当前视野内
if (bounds.contains([north, index])) {
// 绘制经线
let lonLine = L.polyline(
[
[-90, index],
[90, index],
],
{ weight: 1, color: "blue" }
);
lonLatGridLineLayer.addLayer(lonLine);
// 标注
let text = index.toFixed(1) + "°";
// 动态计算小数位数
if (zoom > 10) {
text = index.toFixed((zoom - 8) / 2) + "°";
}
let divIcon = L.divIcon({
html: `<div >${text}</div>`,
iconAnchor: [0, -5],
});
let textMarker = L.marker([north, index], { icon: divIcon });
lonLatGridLineLayer.addLayer(textMarker);
}
}
if(d>90)d=90;
// 纬线网格
for (let index = -90; index <= 90; index += d) {
if (bounds.contains([index, east])) {
let lonLine = L.polyline(
[
[index, -180],
[index, 360],
],
{ weight: 1, color: "blue" }
);
lonLatGridLineLayer.addLayer(lonLine);
// 标注
let text = index.toFixed(1) + "°";
if (zoom > 10) {
text = index.toFixed((zoom - 8) / 2) + "°";
}
let divIcon = L.divIcon({
html: `<div >${text}</div>`,
iconAnchor: [(text.length + 1) * 6, 0],
});
let textMarker = L.marker([index, east], { icon: divIcon });
lonLatGridLineLayer.addLayer(textMarker);
}
}
};
addLonLatLine();
map.on("zoomend move", () => {
lonLatGridLineLayer.clearLayers();
addLonLatLine();
});
</script>
</body>
</html>from branca.element import MacroElement,
from jinja2 import Template
from folium.vector_layers import path_options
class Jwwg(MacroElement):
"""自定义经纬线网格"""
_template = Template("""
{% macro script(this, kwargs) %}
var map = mapsPlaceholder.pop();
// 创建图层
let lonLatGridLineLayer = L.featureGroup().addTo(map);
// 经纬网格生成方法
let addLonLatLine = () => {
let zoom = map.getZoom();
let bounds = map.getBounds();
let north = bounds.getNorth();
let east = bounds.getEast();
// 经纬度间隔
let d = 90 / Math.pow(2, zoom - 1);
// 经线网格
for (let index = -180; index <= 360; index += d) {
// 判断当前视野内
if (bounds.contains([north, index])) {
// 绘制经线
let lonLine = L.polyline(
[
[-90, index],
[90, index],
],
{weight: 1, color: "blue"}
);
lonLatGridLineLayer.addLayer(lonLine);
// 标注
let text = index.toFixed(1) + "°";
// 动态计算小数位数
if (zoom > 10) {
text = index.toFixed((zoom - 8) / 2) + "°";
}
let divIcon = L.divIcon({
html: `<div >${text}</div>`,
iconAnchor: [0, -5],
});
let textMarker = L.marker([north, index], {icon: divIcon});
lonLatGridLineLayer.addLayer(textMarker);
}
}
if (d > 90) d = 90;
// 纬线网格
for (let index = -90; index <= 90; index += d) {
if (bounds.contains([index, east])) {
let lonLine = L.polyline(
[
[index, -180],
[index, 360],
],
{weight: 1, color: "blue"}
);
lonLatGridLineLayer.addLayer(lonLine);
// 标注
let text = index.toFixed(1) + "°";
if (zoom > 10) {
text = index.toFixed((zoom - 8) / 2) + "°";
}
let divIcon = L.divIcon({
html: `<div >${text}</div>`,
iconAnchor: [(text.length + 1) * 6, 0],
});
let textMarker = L.marker([index, east], {icon: divIcon});
lonLatGridLineLayer.addLayer(textMarker);
}
}
};
addLonLatLine();
map.on("zoomend move", () => {
lonLatGridLineLayer.clearLayers();
addLonLatLine();
});
{% endmacro %}
""")
def __init__(self, **kwargs):
super(Jwwg, self).__init__()
self._name = 'Jwwg'
self.options = path_options(line=True, **kwargs)import folium
def map2png(map_data,out_file='pdf.png'):
# 1.直接构造,默认底图
mo = folium.Map(location=[0, 0])
# 2.图层1-高德底图+数据
fg = folium.FeatureGroup()
# 2.1 高德地图
fg.add_child(folium.TileLayer(
tiles='http://webrd02.is.autonavi.com/appmaptile?lang=zh_cn&size=1&scale=1&style=8&x={x}&y={y}&z={z}',
attr="© <a href=http://ditu.amap.com/>高德地图</a>",
min_zoom=0,
max_zoom=19,
control=True,
zoom_control=False,
show=True))
# 2.2添加一个点
fg.add_child(folium.Marker(
location=[45.3311, -121.7113],
popup="Timberline Lodge",
icon=folium.Icon(color="green")))
# 2.3添加一个线形
fg.add_child(folium.PolyLine(
locations=[[38.68,115.67],
[38.85,115.48],
[38.65,115.37],
[38.68,115.67]],
color='green', weight=2, opacity=1))
# 2.4添加一个面
fg.add_child(folium.Polygon(
locations=[[38.68,115.67],
[38.85,115.48],
[38.65,115.37],
[38.68,115.67]],
color='green', weight=2,
fill=True,fill_color = 'red'))
# 2.5将我们的图层加入map
mo.add_child(fg)
# 5.根据范围缩放地图
mo.fit_bounds([[38.68,115.67],
[38.85,115.48],
[38.65,115.37],
[38.68,115.67]])
# 网格线
init_script = """
var mapsPlaceholder = [];
L.Map.addInitHook(function () {mapsPlaceholder.push(this);});
"""
mo.get_root().script.add_child(folium.Element(init_script))
Jwwg().add_to(mo)
root = mo.get_root()
html = root.render() # 这个拿到的就是一个html的内容
# mo.save('text.html')로그인 후 복사
import folium
def map2png(map_data,out_file='pdf.png'):
# 1.直接构造,默认底图
mo = folium.Map(location=[0, 0])
# 2.图层1-高德底图+数据
fg = folium.FeatureGroup()
# 2.1 高德地图
fg.add_child(folium.TileLayer(
tiles='http://webrd02.is.autonavi.com/appmaptile?lang=zh_cn&size=1&scale=1&style=8&x={x}&y={y}&z={z}',
attr="© <a href=http://ditu.amap.com/>高德地图</a>",
min_zoom=0,
max_zoom=19,
control=True,
zoom_control=False,
show=True))
# 2.2添加一个点
fg.add_child(folium.Marker(
location=[45.3311, -121.7113],
popup="Timberline Lodge",
icon=folium.Icon(color="green")))
# 2.3添加一个线形
fg.add_child(folium.PolyLine(
locations=[[38.68,115.67],
[38.85,115.48],
[38.65,115.37],
[38.68,115.67]],
color='green', weight=2, opacity=1))
# 2.4添加一个面
fg.add_child(folium.Polygon(
locations=[[38.68,115.67],
[38.85,115.48],
[38.65,115.37],
[38.68,115.67]],
color='green', weight=2,
fill=True,fill_color = 'red'))
# 2.5将我们的图层加入map
mo.add_child(fg)
# 5.根据范围缩放地图
mo.fit_bounds([[38.68,115.67],
[38.85,115.48],
[38.65,115.37],
[38.68,115.67]])
# 网格线
init_script = """
var mapsPlaceholder = [];
L.Map.addInitHook(function () {mapsPlaceholder.push(this);});
"""
mo.get_root().script.add_child(folium.Element(init_script))
Jwwg().add_to(mo)
root = mo.get_root()
html = root.render() # 这个拿到的就是一个html的内容
# mo.save('text.html')위 내용은 Python folium의 기능을 사용하는 방법의 상세 내용입니다. 자세한 내용은 PHP 중국어 웹사이트의 기타 관련 기사를 참조하세요!

핫 AI 도구

Undresser.AI Undress
사실적인 누드 사진을 만들기 위한 AI 기반 앱

AI Clothes Remover
사진에서 옷을 제거하는 온라인 AI 도구입니다.

Undress AI Tool
무료로 이미지를 벗다

Clothoff.io
AI 옷 제거제

AI Hentai Generator
AI Hentai를 무료로 생성하십시오.

인기 기사

뜨거운 도구

메모장++7.3.1
사용하기 쉬운 무료 코드 편집기

SublimeText3 중국어 버전
중국어 버전, 사용하기 매우 쉽습니다.

스튜디오 13.0.1 보내기
강력한 PHP 통합 개발 환경

드림위버 CS6
시각적 웹 개발 도구

SublimeText3 Mac 버전
신 수준의 코드 편집 소프트웨어(SublimeText3)

뜨거운 주제
 7445
7445
 15
15
 1374
1374
 52
52
 76
76
 11
11
 39
39
 19
19
 14
14
 6
6
 누가 더 많은 파이썬이나 자바 스크립트를 지불합니까?
Apr 04, 2025 am 12:09 AM
기술 및 산업 요구에 따라 Python 및 JavaScript 개발자에 대한 절대 급여는 없습니다. 1. 파이썬은 데이터 과학 및 기계 학습에서 더 많은 비용을 지불 할 수 있습니다. 2. JavaScript는 프론트 엔드 및 풀 스택 개발에 큰 수요가 있으며 급여도 상당합니다. 3. 영향 요인에는 경험, 지리적 위치, 회사 규모 및 특정 기술이 포함됩니다.
 H5 페이지 생산에는 지속적인 유지 보수가 필요합니까?
Apr 05, 2025 pm 11:27 PM
코드 취약점, 브라우저 호환성, 성능 최적화, 보안 업데이트 및 사용자 경험 개선과 같은 요소로 인해 H5 페이지를 지속적으로 유지해야합니다. 효과적인 유지 관리 방법에는 완전한 테스트 시스템 설정, 버전 제어 도구 사용, 페이지 성능을 정기적으로 모니터링하고 사용자 피드백 수집 및 유지 관리 계획을 수립하는 것이 포함됩니다.
 별개의 구별이 관련되어 있습니까?
Apr 03, 2025 pm 10:30 PM
구별되고 구별되는 것은 구별과 관련이 있지만, 다르게 사용됩니다. 뚜렷한 (형용사)는 사물 자체의 독창성을 묘사하고 사물 사이의 차이를 강조하는 데 사용됩니다. 뚜렷한 (동사)는 구별 행동이나 능력을 나타내며 차별 과정을 설명하는 데 사용됩니다. 프로그래밍에서 구별은 종종 중복 제거 작업과 같은 컬렉션에서 요소의 독창성을 나타내는 데 사용됩니다. 홀수 및 짝수 숫자를 구별하는 것과 같은 알고리즘이나 함수의 설계에 별개가 반영됩니다. 최적화 할 때 별도의 작업은 적절한 알고리즘 및 데이터 구조를 선택해야하며, 고유 한 작업은 논리 효율성의 구별을 최적화하고 명확하고 읽을 수있는 코드 작성에주의를 기울여야합니다.
 C 언어에서 합계는 무엇을 의미합니까?
Apr 03, 2025 pm 02:36 PM
합에 대한 C에는 내장 합계 기능이 없지만 다음과 같이 구현할 수 있습니다. 루프를 사용하여 요소를 하나씩 축적합니다. 포인터를 사용하여 요소를 하나씩 액세스하고 축적합니다. 큰 데이터 볼륨의 경우 병렬 계산을 고려하십시오.
 PS가 계속 로딩을 보여주는 이유는 무엇입니까?
Apr 06, 2025 pm 06:39 PM
PS "로드"문제는 자원 액세스 또는 처리 문제로 인한 것입니다. 하드 디스크 판독 속도는 느리거나 나쁘다 : CrystalDiskinfo를 사용하여 하드 디스크 건강을 확인하고 문제가있는 하드 디스크를 교체하십시오. 불충분 한 메모리 : 고해상도 이미지 및 복잡한 레이어 처리에 대한 PS의 요구를 충족시키기 위해 메모리 업그레이드 메모리. 그래픽 카드 드라이버는 구식 또는 손상됩니다. 운전자를 업데이트하여 PS와 그래픽 카드 간의 통신을 최적화하십시오. 파일 경로는 너무 길거나 파일 이름에는 특수 문자가 있습니다. 짧은 경로를 사용하고 특수 문자를 피하십시오. PS 자체 문제 : PS 설치 프로그램을 다시 설치하거나 수리하십시오.
 58.com 작업 페이지에서 실시간 응용 프로그램 및 뷰어 데이터를 얻는 방법은 무엇입니까?
Apr 05, 2025 am 08:06 AM
크롤링하는 동안 58.com 작업 페이지의 동적 데이터를 얻는 방법은 무엇입니까? Crawler 도구를 사용하여 58.com의 작업 페이지를 크롤링 할 때는이 문제가 발생할 수 있습니다.
 사랑 코드 복사 및 붙여 넣기 복사하여 사랑 코드를 무료로 붙여 넣으십시오.
Apr 04, 2025 am 06:48 AM
코드 복사 및 붙여 넣기는 불가능하지는 않지만주의해서 처리해야합니다. 코드의 환경, 라이브러리, 버전 등과 같은 종속성은 현재 프로젝트와 일치하지 않으므로 오류 또는 예측할 수없는 결과를 초래할 수 있습니다. 파일 경로, 종속 라이브러리 및 Python 버전을 포함하여 컨텍스트가 일관되게 유지하십시오. 또한 특정 라이브러리의 코드를 복사 및 붙여 넣을 때 라이브러리 및 해당 종속성을 설치해야 할 수도 있습니다. 일반적인 오류에는 경로 오류, 버전 충돌 및 일관되지 않은 코드 스타일이 포함됩니다. 성능 최적화는 코드의 원래 목적 및 제약에 따라 재 설계 또는 리팩토링되어야합니다. 복사 코드를 이해하고 디버그하고 맹목적으로 복사하여 붙여 넣지 않는 것이 중요합니다.
 JavaScript 코드 라인 브레이크 : 긴 문자열 및 객체 속성을 처리하는 방법을 우아하게 처리하는 방법은 무엇입니까?
Apr 05, 2025 am 08:03 AM
JavaScript 코드 라인 브레이킹 기술에 대한 자세한 설명 JavaScript 코드를 작성할 때 종종 코드의 가독성에 영향을 줄뿐만 아니라 너무 긴 코드 라인이 발생합니다.


