 pembangunan bahagian belakang
 Tutorial Python
 Cuba analisis data bahasa semula jadi dengan Streamlit in Snowflake (SiS)
Cuba analisis data bahasa semula jadi dengan Streamlit in Snowflake (SiS)
pengenalan
Snowflake telah mengeluarkan ciri pembantu LLM yang dipanggil Snowflake Copilot sebagai ciri pratonton. Dengan Snowflake Copilot, anda boleh menganalisis data jadual menggunakan bahasa semula jadi.
Sebaliknya, Streamlit in Snowflake (SiS) membolehkan anda dengan mudah menggabungkan AI generatif dan mengakses data jadual dengan selamat. Ini membuatkan saya berfikir: bolehkah kita mencipta alat analisis data bahasa semula jadi yang lebih proaktif? Jadi, saya membangunkan apl yang boleh menganalisis dan menggambarkan data menggunakan bahasa semula jadi.
Nota: Catatan ini mewakili pandangan peribadi saya dan bukan pandangan Snowflake.
Gambaran Keseluruhan Ciri
Matlamat
- Boleh digunakan oleh pengguna perniagaan yang tidak biasa dengan SQL
- Keupayaan untuk memilih DB / skema / jadual melalui operasi tetikus untuk analisis
- Mampu menganalisis dengan pertanyaan bahasa semula jadi yang sangat samar-samar
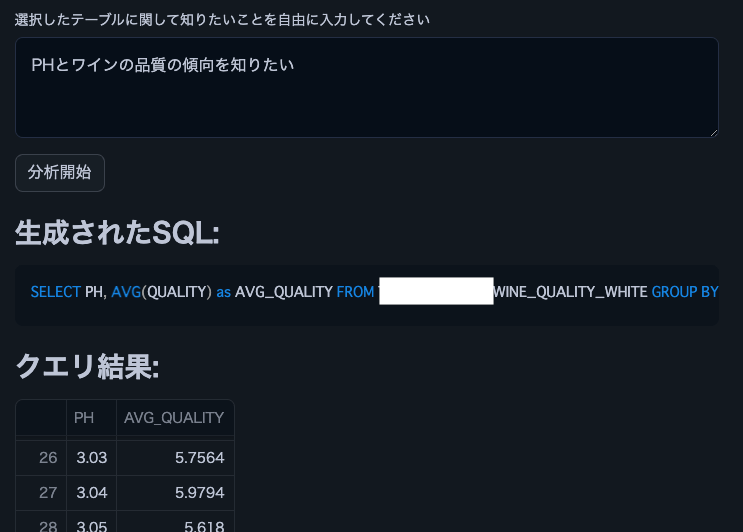
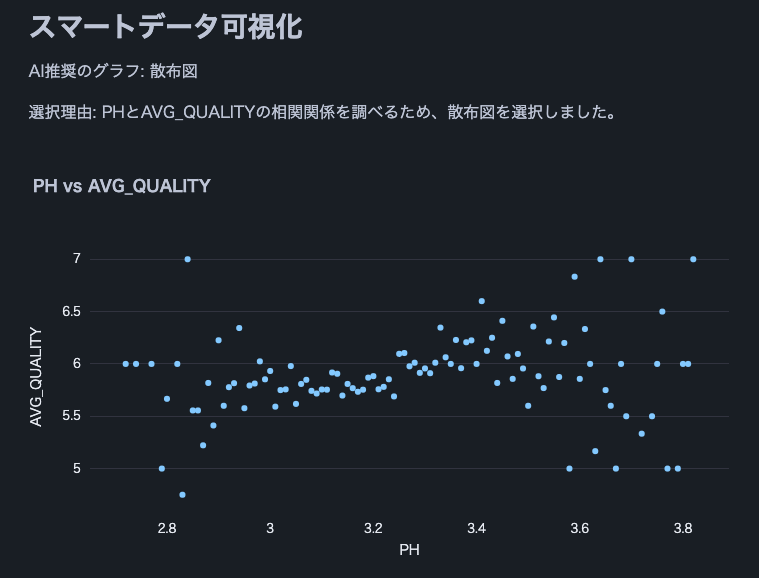
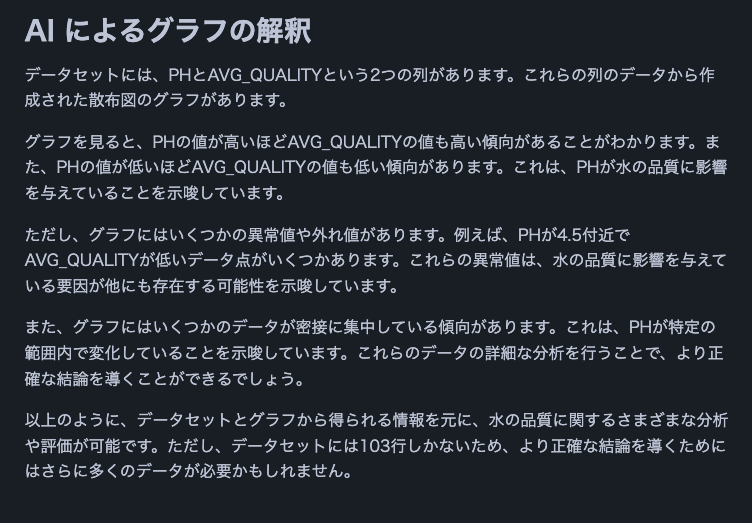
Tangkapan Skrin Sebenar (Petikan)
Berikut adalah petikan daripada keputusan analisis menggunakan Cortex LLM (snowflake-arctic).


Nota: Kami menggunakan set data kualiti wain ini.
Senarai Ciri
- Pilih Cortex LLM untuk analisis
- Pilih DB / skema / jadual untuk analisis
- Paparkan maklumat lajur dan data sampel jadual yang dipilih
- Analisis menggunakan input bahasa semula jadi daripada pengguna
- Penjanaan SQL automatik untuk analisis
- Pelaksanaan automatik SQL yang dijana
- Paparan hasil pelaksanaan pertanyaan SQL
- Cerapan data disediakan oleh Cortex LLM
- Penggambaran data
- Pemilihan dan paparan graf yang sesuai oleh Cortex LLM
- Tafsiran data akhir oleh Cortex LLM
Keadaan Operasi
- Akaun Snowflake dengan akses kepada Cortex LLM
- snowflake-ml-python 1.1.2 atau lebih baru
Langkah berjaga-berjaga
- Berhati-hati apabila menggunakan set data yang besar kerana tiada had data ditetapkan
- Set hasil yang besar daripada pertanyaan SQL yang dijana mungkin mengambil masa untuk diproses
- Set hasil yang besar boleh menyebabkan ralat had token LLM
Kod Sumber
from snowflake.snowpark.context import get_active_session
import streamlit as st
from snowflake.cortex import Complete as CompleteText
import snowflake.snowpark.functions as F
import pandas as pd
import numpy as np
import json
import plotly.express as px

# Get current session
session = get_active_session()

# Application title
st.title("Natural Language Data Analysis App")

# Cortex LLM settings
st.sidebar.title("Cortex LLM Settings")
lang_model = st.sidebar.radio("Select the language model you want to use",
                              ("snowflake-arctic", "reka-flash", "reka-core",
                               "mistral-large2", "mistral-large", "mixtral-8x7b", "mistral-7b",
                               "llama3.1-405b", "llama3.1-70b", "llama3.1-8b",
                               "llama3-70b", "llama3-8b", "llama2-70b-chat",
                               "jamba-instruct", "gemma-7b")
)

# Function to escape column names
def escape_column_name(name):
    return f'"{name}"'

# Function to get table information
def get_table_info(database, schema, table):
    # Get column information
    columns = session.sql(f"DESCRIBE TABLE {database}.{schema}.{table}").collect()

    # Create DataFrame
    column_df = pd.DataFrame(columns)

    # Get row count
    row_count = session.sql(f"SELECT COUNT(*) as count FROM {database}.{schema}.{table}").collect()[0]['COUNT']

    # Get sample data
    sample_data = session.sql(f"SELECT * FROM {database}.{schema}.{table} LIMIT 5").collect()
    sample_df = pd.DataFrame(sample_data)

    return column_df, row_count, sample_df

# Data analysis function
def analyze(df, query):
    st.subheader("Result Analysis")

    # Display basic statistical information
    st.subheader("Basic Statistics")
    st.write(df.describe())

    # Use AI for data analysis
    analysis_prompt = f"""
    Based on the following dataframe and original question, please perform data analysis.
    Concisely explain in English the insights, trends, and anomalies derived from the data.
    If possible, please also mention the following points:
    1. Data distribution and characteristics
    2. Presence of abnormal values or outliers
    3. Correlations between columns (if there are multiple numeric columns)
    4. Time-series trends (if there is date or time data)
    5. Category-specific features (if data can be divided by categories)

    Dataframe:
    {df.to_string()}

    Original question:
    {query}
    """

    analysis = CompleteText(lang_model, analysis_prompt)
    st.write(analysis)

# Data visualization function
def smart_data_visualization(df):
    st.subheader("Smart Data Visualization")

    if df.empty:
        st.warning("The dataframe is empty. There is no data to visualize.")
        return

    # Request AI for graph suggestion
    columns_info = "\n".join([f"{col} - type: {df[col].dtype}" for col in df.columns])
    sample_data = df.head().to_string()

    visualization_prompt = f"""
    Analyze the information of the following dataframe and suggest the most appropriate graph type and the columns to use for its x-axis and y-axis.
    Consider the characteristics of the data to ensure a meaningful visualization.

    Column information:
    {columns_info}

    Sample data:
    {sample_data}

    Please provide only the following JSON data format as your response:
    {{
        "graph_type": "One of: scatter plot, bar chart, line chart, histogram, box plot",
        "x_axis": "Column name to use for x-axis",
        "y_axis": "Column name to use for y-axis (if applicable)",
        "explanation": "Brief explanation of the selection reason"
    }}
    """

    ai_suggestion = CompleteText(lang_model, visualization_prompt)

    try:
        suggestion = json.loads(ai_suggestion)
        graph_type = suggestion['graph_type']
        x_axis = suggestion['x_axis']
        y_axis = suggestion.get('y_axis')  # y-axis might not be needed in some cases
        explanation = suggestion['explanation']

        st.write(f"AI recommended graph: {graph_type}")
        st.write(f"Selection reason: {explanation}")

        if graph_type == "scatter plot":
            fig = px.scatter(df, x=x_axis, y=y_axis, title=f"{x_axis} vs {y_axis}")
        elif graph_type == "bar chart":
            fig = px.bar(df, x=x_axis, y=y_axis, title=f"{y_axis} by {x_axis}")
        elif graph_type == "line chart":
            fig = px.line(df, x=x_axis, y=y_axis, title=f"{y_axis} over {x_axis}")
        elif graph_type == "histogram":
            fig = px.histogram(df, x=x_axis, title=f"Distribution of {x_axis}")
        elif graph_type == "box plot":
            fig = px.box(df, x=x_axis, y=y_axis, title=f"Distribution of {y_axis} by {x_axis}")
        else:
            st.warning(f"Unsupported graph type: {graph_type}")
            return

        st.plotly_chart(fig)

    except json.JSONDecodeError:
        st.error("Failed to parse AI suggestion. Please try again.")
    except KeyError as e:
        st.error(f"AI suggestion is missing necessary information: {str(e)}")
    except Exception as e:
        st.error(f"An error occurred while creating the graph: {str(e)}")

    # AI interpretation of visualization
    visualization_interpretation_prompt = f"""
    Based on the following dataset and created graph, please provide a detailed interpretation of the data trends and characteristics in English.
    Point out possible insights, patterns, anomalies, or areas that require additional analysis.

    Dataset information:
    Columns: {', '.join(df.columns)}
    Number of rows: {len(df)}

    Created graph:
    Type: {graph_type}
    X-axis: {x_axis}
    Y-axis: {y_axis if y_axis else 'None'}
    """

    ai_interpretation = CompleteText(lang_model, visualization_interpretation_prompt)
    st.subheader("AI Interpretation of the Graph")
    st.write(ai_interpretation)

# Function to handle cases where AI response is not just SQL query
def clean_sql_query(query):
    # Remove leading and trailing whitespace
    query = query.strip()
    # If not starting with SQL keywords, remove everything up to the first SELECT
    if not query.upper().startswith(('SELECT')):
        keywords = ['SELECT']
        for keyword in keywords:
            if keyword in query.upper():
                query = query[query.upper().index(keyword):]
                break
    return query

# Function for natural language querying of DB
def data_analysis_and_natural_language_query():
    # Database selection
    databases = session.sql("SHOW DATABASES").collect()
    database_names = [row['name'] for row in databases]
    selected_database = st.selectbox("Select a database", database_names)

    if selected_database:
        # Schema selection
        schemas = session.sql(f"SHOW SCHEMAS IN DATABASE {selected_database}").collect()
        schema_names = [row['name'] for row in schemas]
        selected_schema = st.selectbox("Select a schema", schema_names)

        if selected_schema:
            # Table selection
            tables = session.sql(f"SHOW TABLES IN {selected_database}.{selected_schema}").collect()
            table_names = [row['name'] for row in tables]
            selected_table = st.selectbox("Select a table", table_names)

            if selected_table:
                # Get table information
                column_df, row_count, sample_df = get_table_info(selected_database, selected_schema, selected_table)

                st.subheader("Table Information")
                st.write(f"Table name: `{selected_database}.{selected_schema}.{selected_table}`")
                st.write(f"Total rows: **{row_count:,}**")

                st.subheader("Column Information")
                st.dataframe(column_df)

                st.subheader("Sample Data (showing only 5 rows)")
                st.dataframe(sample_df)

                # Stringify table information (for AI)
                table_info = f"""
                Table name: {selected_database}.{selected_schema}.{selected_table}
                Total rows: {row_count}

                Column information:
                {column_df.to_string(index=False)}
                Sample data:
                {sample_df.to_string(index=False)}
                """

                # Natural language input from user
                user_query = st.text_area("Enter what you want to know about the selected table")

                if st.button("Start Analysis"):
                    if user_query:
                        # Use AI to generate SQL
                        prompt = f"""
                        Based on the following table information and question, please generate an appropriate SQL query.
                        Return only the generated SQL query without any additional response.

                        Table information:
                        {table_info}

                        Question: {user_query}

                        Notes:
                        - Follow Snowflake SQL syntax.
                        - Use aggregate functions to keep the query result size manageable.
                        - Use {selected_database}.{selected_schema}.{selected_table} as the table name.
                        """

                        generated_sql = CompleteText(lang_model, prompt)
                        generated_sql = clean_sql_query(generated_sql)
                        st.subheader("Generated SQL:")
                        st.code(generated_sql, language='sql')

                        try:
                            # Execute the generated SQL
                            result = session.sql(generated_sql).collect()
                            df = pd.DataFrame(result)

                            st.subheader("Query Result:")
                            st.dataframe(df)

                            # Analyze results
                            analyze(df, user_query)

                            # Smart data visualization
                            smart_data_visualization(df)

                        except Exception as e:
                            st.error(f"An error occurred while executing the query: {str(e)}")
                    else:
                        st.warning("Please enter a question.")

# Execution part
data_analysis_and_natural_language_query()
Kesimpulan
Keupayaan untuk menganalisis data jadual dengan mudah menggunakan bahasa semula jadi tanpa pengetahuan SQL atau Python boleh meluaskan skop penggunaan data dengan ketara dalam perusahaan untuk pengguna perniagaan. Dengan menambahkan ciri seperti menyertai berbilang jadual atau meningkatkan kepelbagaian graf visualisasi, analisis yang lebih kompleks boleh dilakukan. Saya menggalakkan semua orang cuba melaksanakan pendemokrasian analisis data menggunakan Streamlit in Snowflake.
Pengumuman
Kepingan Salji Apakah Kemas Kini Baharu pada X
Saya berkongsi kemas kini Snowflake's What's New pada X. Sila ikuti jika anda berminat!
Versi Bahasa Inggeris
Snowflake What's New Bot (Versi Bahasa Inggeris)
https://x.com/snow_new_en
Versi Jepun
Bot Baharu Kepingan Salji (Versi Jepun)
https://x.com/snow_new_jp
Sejarah Perubahan
(20240914) Catatan awal
Artikel Asal Jepun
https://zenn.dev/tsubasa_tech/articles/2608c820294860
Atas ialah kandungan terperinci Cuba analisis data bahasa semula jadi dengan Streamlit in Snowflake (SiS). Untuk maklumat lanjut, sila ikut artikel berkaitan lain di laman web China PHP!

Alat AI Hot

Undresser.AI Undress
Apl berkuasa AI untuk mencipta foto bogel yang realistik

AI Clothes Remover
Alat AI dalam talian untuk mengeluarkan pakaian daripada foto.

Undress AI Tool
Gambar buka pakaian secara percuma

Clothoff.io
Penyingkiran pakaian AI

Video Face Swap
Tukar muka dalam mana-mana video dengan mudah menggunakan alat tukar muka AI percuma kami!

Artikel Panas

Alat panas

Notepad++7.3.1
Editor kod yang mudah digunakan dan percuma

SublimeText3 versi Cina
Versi Cina, sangat mudah digunakan

Hantar Studio 13.0.1
Persekitaran pembangunan bersepadu PHP yang berkuasa

Dreamweaver CS6
Alat pembangunan web visual

SublimeText3 versi Mac
Perisian penyuntingan kod peringkat Tuhan (SublimeText3)

Topik panas
 1676
1676
 14
14
 1429
1429
 52
52
 1333
1333
 25
25
 1278
1278
 29
29
 1257
1257
 24
24
 Python vs C: Lengkung pembelajaran dan kemudahan penggunaan
Apr 19, 2025 am 12:20 AM
Python lebih mudah dipelajari dan digunakan, manakala C lebih kuat tetapi kompleks. 1. Sintaks Python adalah ringkas dan sesuai untuk pemula. Penaipan dinamik dan pengurusan memori automatik menjadikannya mudah digunakan, tetapi boleh menyebabkan kesilapan runtime. 2.C menyediakan kawalan peringkat rendah dan ciri-ciri canggih, sesuai untuk aplikasi berprestasi tinggi, tetapi mempunyai ambang pembelajaran yang tinggi dan memerlukan memori manual dan pengurusan keselamatan jenis.
 Pembelajaran Python: Adakah 2 jam kajian harian mencukupi?
Apr 18, 2025 am 12:22 AM
Adakah cukup untuk belajar Python selama dua jam sehari? Ia bergantung pada matlamat dan kaedah pembelajaran anda. 1) Membangunkan pelan pembelajaran yang jelas, 2) Pilih sumber dan kaedah pembelajaran yang sesuai, 3) mengamalkan dan mengkaji semula dan menyatukan amalan tangan dan mengkaji semula dan menyatukan, dan anda secara beransur-ansur boleh menguasai pengetahuan asas dan fungsi lanjutan Python dalam tempoh ini.
 Python vs C: Meneroka Prestasi dan Kecekapan
Apr 18, 2025 am 12:20 AM
Python lebih baik daripada C dalam kecekapan pembangunan, tetapi C lebih tinggi dalam prestasi pelaksanaan. 1. Sintaks ringkas Python dan perpustakaan yang kaya meningkatkan kecekapan pembangunan. 2. Ciri-ciri jenis kompilasi dan kawalan perkakasan meningkatkan prestasi pelaksanaan. Apabila membuat pilihan, anda perlu menimbang kelajuan pembangunan dan kecekapan pelaksanaan berdasarkan keperluan projek.
 Python vs C: Memahami perbezaan utama
Apr 21, 2025 am 12:18 AM
Python dan C masing -masing mempunyai kelebihan sendiri, dan pilihannya harus berdasarkan keperluan projek. 1) Python sesuai untuk pembangunan pesat dan pemprosesan data kerana sintaks ringkas dan menaip dinamik. 2) C sesuai untuk prestasi tinggi dan pengaturcaraan sistem kerana menaip statik dan pengurusan memori manual.
 Yang merupakan sebahagian daripada Perpustakaan Standard Python: Senarai atau Array?
Apr 27, 2025 am 12:03 AM
Pythonlistsarepartofthestandardlibrary, sementara
 Python: Automasi, skrip, dan pengurusan tugas
Apr 16, 2025 am 12:14 AM
Python cemerlang dalam automasi, skrip, dan pengurusan tugas. 1) Automasi: Sandaran fail direalisasikan melalui perpustakaan standard seperti OS dan Shutil. 2) Penulisan Skrip: Gunakan Perpustakaan Psutil untuk memantau sumber sistem. 3) Pengurusan Tugas: Gunakan perpustakaan jadual untuk menjadualkan tugas. Kemudahan penggunaan Python dan sokongan perpustakaan yang kaya menjadikannya alat pilihan di kawasan ini.
 Python untuk pengkomputeran saintifik: rupa terperinci
Apr 19, 2025 am 12:15 AM
Aplikasi Python dalam pengkomputeran saintifik termasuk analisis data, pembelajaran mesin, simulasi berangka dan visualisasi. 1.Numpy menyediakan susunan pelbagai dimensi yang cekap dan fungsi matematik. 2. Scipy memanjangkan fungsi numpy dan menyediakan pengoptimuman dan alat algebra linear. 3. Pandas digunakan untuk pemprosesan dan analisis data. 4.Matplotlib digunakan untuk menghasilkan pelbagai graf dan hasil visual.
 Python untuk Pembangunan Web: Aplikasi Utama
Apr 18, 2025 am 12:20 AM
Aplikasi utama Python dalam pembangunan web termasuk penggunaan kerangka Django dan Flask, pembangunan API, analisis data dan visualisasi, pembelajaran mesin dan AI, dan pengoptimuman prestasi. 1. Rangka Kerja Django dan Flask: Django sesuai untuk perkembangan pesat aplikasi kompleks, dan Flask sesuai untuk projek kecil atau sangat disesuaikan. 2. Pembangunan API: Gunakan Flask atau DjangorestFramework untuk membina Restfulapi. 3. Analisis Data dan Visualisasi: Gunakan Python untuk memproses data dan memaparkannya melalui antara muka web. 4. Pembelajaran Mesin dan AI: Python digunakan untuk membina aplikasi web pintar. 5. Pengoptimuman Prestasi: Dioptimumkan melalui pengaturcaraan, caching dan kod tak segerak


