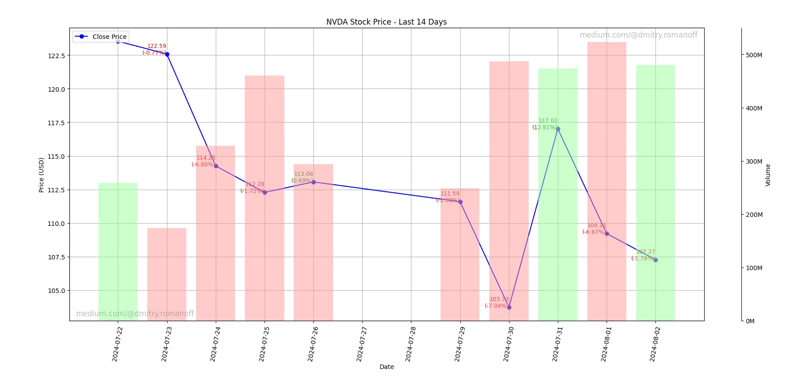

Berikut ialah penerangan terperinci tentang perkara yang dilakukan oleh setiap bahagian kod:
matplotlib.pyplot digunakan untuk mencipta plot.
yahooquery.Ticker digunakan untuk mengambil data stok sejarah daripada Yahoo Finance.
datetime dan timedelta digunakan untuk manipulasi tarikh.
panda digunakan untuk pengendalian data.
pytz digunakan untuk bekerja dengan zon waktu.
os digunakan untuk operasi sistem fail.
Parameter Fungsi:
simbol: penanda saham (mis., ‘NVDA’).
n_days: bilangan hari untuk data sejarah dipaparkan.
nama fail: nama fail tempat plot akan disimpan.
zon waktu: zon waktu untuk memaparkan data.
Tarikh semasa dan tarikh mula tempoh dikira berdasarkan n_hari.
yahooquery digunakan untuk mendapatkan semula data stok sejarah untuk tempoh yang ditentukan.
Jika tiada data tersedia, mesej dicetak dan fungsi itu akan keluar.
Indeks data ditukar kepada format datetime dan zon waktu ditetapkan.
Hujung minggu (Sabtu dan Ahad) ditapis.
Peratusan perubahan dalam harga penutupan dikira.
Plot utama dibuat dengan harga penutup.
Anotasi ditambahkan pada plot yang menunjukkan harga penutupan dan perubahan peratusan.
Paksi X dan Y dikonfigurasikan, tarikh diformat dan garis grid ditambah.
Plot tambahan untuk volum dagangan ditambah, dengan warna yang berbeza untuk perubahan positif dan negatif dalam harga penutupan.
Tanda air ditambahkan pada penjuru kiri bawah dan kanan atas plot.
Plot disimpan sebagai fail imej dengan nama fail yang ditentukan dan dipaparkan.
Fungsi ini dipanggil dengan penanda ‘NVDA’ (NVIDIA), memaparkan data selama 14 hari terakhir, menyimpan plot sebagai ‘output.png’ dan menggunakan zon waktu GMT.
Ringkasnya, kod menjana perwakilan visual data stok sejarah, termasuk harga penutupan dan volum dagangan, dengan anotasi untuk perubahan peratusan dan pertimbangan zon waktu.
import matplotlib.pyplot as plt
from yahooquery import Ticker
from datetime import datetime, timedelta
import matplotlib.dates as mdates
import os
import pandas as pd
import pytz

def plot_stock_last_n_days(symbol, n_days=30, filename='stock_plot.png', timezone='UTC'):
    # Define the date range
    end_date = datetime.now(pytz.timezone(timezone))
    start_date = end_date - timedelta(days=n_days)

    # Convert dates to the format expected by Yahoo Finance
    start_date_str = start_date.strftime('%Y-%m-%d')
    end_date_str = end_date.strftime('%Y-%m-%d')

    # Fetch historical data for the last n days
    ticker = Ticker(symbol)
    historical_data = ticker.history(start=start_date_str, end=end_date_str, interval='1d')

    # Check if the data is available
    if historical_data.empty:
        print("No data available.")
        return

    # Ensure the index is datetime for proper plotting and localize to the specified timezone
    historical_data.index = pd.to_datetime(historical_data.index.get_level_values('date')).tz_localize('UTC').tz_convert(timezone)

    # Filter out weekends
    historical_data = historical_data[historical_data.index.weekday < 5]

    # Calculate percentage changes
    historical_data['pct_change'] = historical_data['close'].pct_change() * 100

    # Ensure the output directory exists
    output_dir = 'output'
    if not os.path.exists(output_dir):
        os.makedirs(output_dir)

    # Adjust the filename to include the output directory
    filename = os.path.join(output_dir, filename)

    # Plotting the closing price
    fig, ax1 = plt.subplots(figsize=(10, 5))
    ax1.plot(historical_data.index, historical_data['close'], label='Close Price', color='blue', marker='o')

    # Annotate each point with its value and percentage change
    for i in range(1, len(historical_data)):
        date = historical_data.index[i]
        close = historical_data['close'].iloc[i]
        pct_change = historical_data['pct_change'].iloc[i]
        color = 'green' if pct_change > 0 else 'red'
        ax1.text(date, close, f'{close:.2f}\n({pct_change:.2f}%)', fontsize=9, ha='right', color=color)

    # Set up daily gridlines and print date for every day
    ax1.xaxis.set_major_locator(mdates.DayLocator(interval=1))
    ax1.xaxis.set_major_formatter(mdates.DateFormatter('%Y-%m-%d'))

    ax1.set_xlabel('Date')
    ax1.set_ylabel('Price (USD)')
    ax1.set_title(f'{symbol} Stock Price - Last {n_days} Days')
    ax1.legend(loc='upper left')
    ax1.grid(True)
    ax1.tick_params(axis='x', rotation=80)
    fig.tight_layout()

    # Adding the trading volume plot
    ax2 = ax1.twinx()
    calm_green = (0.6, 1, 0.6)  # Calm green color
    calm_red = (1, 0.6, 0.6)    # Calm red color
    colors = [calm_green if historical_data['close'].iloc[i] > historical_data['open'].iloc[i] else calm_red for i in range(len(historical_data))]
    ax2.bar(historical_data.index, historical_data['volume'], color=colors, alpha=0.5, width=0.8)
    ax2.set_ylabel('Volume')
    ax2.tick_params(axis='y')

    # Format y-axis for volume in millions
    def millions(x, pos):
        'The two args are the value and tick position'
        return '%1.0fM' % (x * 1e-6)

    ax2.yaxis.set_major_formatter(plt.FuncFormatter(millions))

    # Adjust the visibility and spacing of the volume axis
    fig.subplots_adjust(right=0.85)
    ax2.spines['right'].set_position(('outward', 60))
    ax2.yaxis.set_label_position('right')
    ax2.yaxis.set_ticks_position('right')

    # Add watermarks
    plt.text(0.01, 0.01, 'medium.com/@dmitry.romanoff', fontsize=12, color='grey', ha='left', va='bottom', alpha=0.5, transform=plt.gca().transAxes)
    plt.text(0.99, 0.99, 'medium.com/@dmitry.romanoff', fontsize=12, color='grey', ha='right', va='top', alpha=0.5, transform=plt.gca().transAxes)

    # Save the plot as an image file
    plt.savefig(filename)
    plt.show()

# Example usage
plot_stock_last_n_days('NVDA', n_days=14, filename='output.png', timezone='GMT')
Atas ialah kandungan terperinci Kod Python yang menjana carta harga saham untuk n hari terakhir.. Untuk maklumat lanjut, sila ikut artikel berkaitan lain di laman web China PHP!
 Bagaimana untuk memulakan semula perkhidmatan dalam rangka kerja swoole
 Hubungan antara lebar jalur dan kelajuan rangkaian
 Bagaimana untuk bertukar antara sistem dwi Huawei
 Kaedah pelaksanaan fungsi main balik dalam talian Python
 Alih keluar baris pengepala
 Apakah perbezaan antara mesin demo dan mesin sebenar?
 Apakah perkembangan sekunder biasa dalam PHP?
 Pengenalan kepada atribut tag artikel


