

cara membuat meja di excel

How to Make a Table in Excel
Creating a table in Excel is a straightforward process that can help you organize and analyze your data more effectively. Here are the steps to create a basic table:
- Open Excel: Start by opening Microsoft Excel on your computer.
- Enter Data: Input your data into the worksheet. Ensure that your data is organized in rows and columns, with headers at the top of each column.
- Select Data: Click and drag to select the range of cells that you want to convert into a table. Make sure to include the headers.
-
Insert Table: Go to the "Insert" tab on the ribbon, and click on the "Table" button. Alternatively, you can use the shortcut
Ctrl + T. - Confirm Table Range: A dialog box will appear, asking you to confirm the range of cells you've selected. Ensure the "My table has headers" checkbox is ticked if your data includes headers, then click "OK."
- Table Creation: Excel will automatically format your selected data into a table, with filter arrows in the header row for easy data sorting and filtering.
What are the Steps to Format a Table in Excel?
Formatting a table in Excel helps improve readability and can make your data more visually appealing. Here are the steps to format a table:
- Select the Table: Click anywhere inside the table you want to format.
- Access Table Tools: Once the table is selected, the "Table Design" tab will appear on the ribbon. Click on it to access various formatting options.
- Choose a Table Style: Under the "Table Styles" section, you'll see various pre-designed table styles. Click on one to apply it to your table. You can hover over the styles to see a live preview before making a selection.
- Customize Table Style: If you want more control over the formatting, click on the "More" button (it looks like a small arrow) in the "Table Styles" section to expand the gallery. You can also use the "New Table Style" option to create a custom style.
- Adjust Table Elements: Use the options in the "Table Style Options" group to toggle features like header row, total row, banded rows, and banded columns on or off.
- Resize the Table: If you need to adjust the size of your table, you can drag the resize handle in the bottom-right corner of the table, or use the "Resize Table" option found under the "Table Design" tab.
- Format Cells: To further customize individual cells, rows, or columns, you can use the standard Excel formatting tools found in the "Home" tab, such as font size, cell color, and borders.
How Can I Customize the Style of a Table in Excel?
Customizing the style of a table in Excel allows you to tailor its appearance to suit your preferences or to meet specific requirements. Here's how you can do it:
- Select the Table: Click inside the table to select it.
- Open Table Design: Go to the "Table Design" tab on the ribbon.
- Select a Predefined Style: Browse through the "Table Styles" gallery and select a style that suits your needs. Hover over the styles to see a live preview.
- Create a Custom Style: If none of the predefined styles meet your requirements, click on "New Table Style" in the "Table Styles" gallery. This opens a dialog box where you can define every aspect of the table's appearance, including font, colors, and border styles.
- Modify Table Elements: Use the "Table Style Options" to toggle on or off elements such as header row, total row, first column, last column, banded rows, and banded columns.
- Adjust Cell Formatting: Use the formatting tools in the "Home" tab to change the font, size, color, and alignment of cells within the table. You can also apply conditional formatting to highlight specific data based on certain criteria.
- Save Custom Style: If you've created a custom style that you want to use in the future, click "New Table Style," name your style, and click "OK." Your custom style will then be available in the "Table Styles" gallery.
What Functions Can I Use to Analyze Data Within an Excel Table?
Excel offers a variety of functions and tools that can be used to analyze data within a table. Here are some useful functions and their applications:
-
SUM: This function calculates the total of selected numerical values. For example,
=SUM(Table1[Column1])will sum all values in Column1 of Table1. -
AVERAGE: This function calculates the average of selected numerical values. For instance,
=AVERAGE(Table1[Column1])will find the average of all values in Column1 of Table1. -
MIN and MAX: These functions find the minimum and maximum values in a range. For example,
=MIN(Table1[Column1])and=MAX(Table1[Column1])will return the lowest and highest values in Column1, respectively. -
COUNT and COUNTA: These functions count the number of cells that contain numbers or any type of data, respectively. For instance,
=COUNT(Table1[Column1])will count the number of cells with numerical values in Column1, while=COUNTA(Table1[Column1])will count all non-empty cells. -
VLOOKUP and HLOOKUP: These functions allow you to search for a value in a table and return a corresponding value from another column or row. For example,
=VLOOKUP(value, Table1, column_index, FALSE)will look up a value in Table1 and return data from the specified column. -
INDEX and MATCH: These functions can be used together to perform more flexible lookups than VLOOKUP or HLOOKUP.
=INDEX(Table1[Column1], MATCH(value, Table1[Column2], 0))will find a value in Column2 and return the corresponding value from Column1. -
SUBTOTAL: This function calculates a subtotal in a list or database, ignoring rows hidden by filters. For instance,
=SUBTOTAL(9, Table1[Column1])will sum all visible values in Column1. - PivotTable: While not a function, PivotTables are powerful tools for summarizing, analyzing, exploring, and presenting data. You can create a PivotTable from your Excel table by selecting the table, going to the "Insert" tab, and clicking on "PivotTable."
Using these functions and tools, you can perform comprehensive data analysis within an Excel table, helping you to make more informed decisions based on your data.
Atas ialah kandungan terperinci cara membuat meja di excel. Untuk maklumat lanjut, sila ikut artikel berkaitan lain di laman web China PHP!

Alat AI Hot

Undresser.AI Undress
Apl berkuasa AI untuk mencipta foto bogel yang realistik

AI Clothes Remover
Alat AI dalam talian untuk mengeluarkan pakaian daripada foto.

Undress AI Tool
Gambar buka pakaian secara percuma

Clothoff.io
Penyingkiran pakaian AI

Video Face Swap
Tukar muka dalam mana-mana video dengan mudah menggunakan alat tukar muka AI percuma kami!

Artikel Panas
Alat panas

Notepad++7.3.1
Editor kod yang mudah digunakan dan percuma

SublimeText3 versi Cina
Versi Cina, sangat mudah digunakan

Hantar Studio 13.0.1
Persekitaran pembangunan bersepadu PHP yang berkuasa

Dreamweaver CS6
Alat pembangunan web visual

SublimeText3 versi Mac
Perisian penyuntingan kod peringkat Tuhan (SublimeText3)
Topik panas
 1655
1655
 14
1414
52
1307
25
1253
29
1227
24
14
1414
52
1307
25
1253
29
1227
24

 Cara menggunakan flash isi excel dengan contoh
Apr 05, 2025 am 09:15 AM
Cara menggunakan flash isi excel dengan contoh
Apr 05, 2025 am 09:15 AM
Tutorial ini menyediakan panduan komprehensif untuk ciri pengisian kilat Excel, alat yang berkuasa untuk mengautomasikan tugas kemasukan data. Ia meliputi pelbagai aspek, dari definisi dan lokasinya untuk penggunaan dan penyelesaian masalah lanjutan. Memahami Fla Excel
 Formula Median di Excel - Contoh Praktikal
Apr 11, 2025 pm 12:08 PM
Formula Median di Excel - Contoh Praktikal
Apr 11, 2025 pm 12:08 PM
Tutorial ini menerangkan cara mengira median data berangka dalam Excel menggunakan fungsi median. Median, ukuran utama kecenderungan pusat, mengenal pasti nilai pertengahan dalam dataset, yang menawarkan perwakilan yang lebih mantap dari Tenden Central
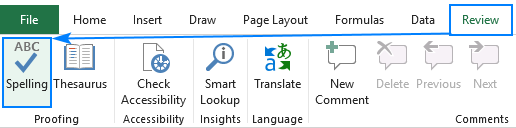 Cara mengeja daftar masuk excel
Apr 06, 2025 am 09:10 AM
Cara mengeja daftar masuk excel
Apr 06, 2025 am 09:10 AM
Tutorial ini menunjukkan pelbagai kaedah untuk pemeriksaan ejaan dalam Excel: cek manual, makro VBA, dan menggunakan alat khusus. Belajar untuk memeriksa ejaan dalam sel, julat, lembaran kerja, dan seluruh buku kerja. Walaupun Excel bukan pemproses kata, spelnya
 Buku Kerja Dikongsi Excel: Cara berkongsi fail Excel untuk beberapa pengguna
Apr 11, 2025 am 11:58 AM
Buku Kerja Dikongsi Excel: Cara berkongsi fail Excel untuk beberapa pengguna
Apr 11, 2025 am 11:58 AM
Tutorial ini menyediakan panduan komprehensif untuk berkongsi buku kerja Excel, meliputi pelbagai kaedah, kawalan akses, dan resolusi konflik. Versi Excel Moden (2010, 2013, 2016, dan kemudian) Memudahkan pengeditan kolaboratif, menghapuskan keperluan untuk m
 Excel: baris kumpulan secara automatik atau secara manual, runtuh dan mengembangkan baris
Apr 08, 2025 am 11:17 AM
Excel: baris kumpulan secara automatik atau secara manual, runtuh dan mengembangkan baris
Apr 08, 2025 am 11:17 AM
Tutorial ini menunjukkan cara menyelaraskan spreadsheet Excel kompleks dengan mengumpulkan baris, menjadikan data lebih mudah untuk dianalisis. Belajar dengan cepat menyembunyikan atau menunjukkan kumpulan baris dan meruntuhkan keseluruhan garis besar ke tahap tertentu. Hamparan besar dan terperinci boleh
 Nilai mutlak dalam Excel: Fungsi ABS dengan contoh formula
Apr 06, 2025 am 09:12 AM
Nilai mutlak dalam Excel: Fungsi ABS dengan contoh formula
Apr 06, 2025 am 09:12 AM
Tutorial ini menerangkan konsep nilai mutlak dan menunjukkan aplikasi Excel praktikal fungsi ABS untuk mengira nilai mutlak dalam dataset. Nombor boleh positif atau negatif, tetapi kadang -kadang hanya nilai positif yang diperlukan
 Cara Menukar Excel ke JPG - Simpan .xls atau .xlsx Sebagai Fail Imej
Apr 11, 2025 am 11:31 AM
Cara Menukar Excel ke JPG - Simpan .xls atau .xlsx Sebagai Fail Imej
Apr 11, 2025 am 11:31 AM
Tutorial ini meneroka pelbagai kaedah untuk menukar fail .xls ke imej .jpg, merangkumi kedua-dua alat Windows terbina dalam dan penukar dalam talian percuma. Perlu membuat persembahan, berkongsi data spreadsheet dengan selamat, atau merancang dokumen? Menukar yo
 COUNTIF SPREWEET COUNTIF Google dengan contoh formula
Apr 11, 2025 pm 12:03 PM
COUNTIF SPREWEET COUNTIF Google dengan contoh formula
Apr 11, 2025 pm 12:03 PM
Menguasai sheet google countif: panduan komprehensif Panduan ini meneroka fungsi countif serba boleh di Helaian Google, menunjukkan aplikasinya di luar pengiraan sel mudah. Kami akan merangkumi pelbagai senario, dari perlawanan tepat dan separa ke Han
