

Excel Groupby berfungsi untuk kumpulan kumpulan dan nilai agregat

Unlock the Power of Excel's GROUPBY Function for Enhanced Data Analysis! This function simplifies data grouping, summarization, sorting, and filtering, all within a single formula. Say goodbye to complex outlines, subtotals, and pivot tables – GROUPBY streamlines your workflow.
Excel's data analysis capabilities just got a significant boost. While features like outlines and pivot tables have long been staples for organizing and interpreting data, the new GROUPBY function offers a more streamlined approach, all within the convenience of your formula bar.
- Understanding the Excel GROUPBY Function: Syntax and Basic Applications
- GROUPBY Function Availability and Compatibility
- Constructing a Basic GROUPBY Formula
- Mastering GROUPBY: Advanced Formula Examples
- Selecting the Right Aggregation Function
- Displaying Headers Effectively
- Grouping Rows Using Multiple Columns
- Grouping with Non-Adjacent Columns
- Controlling the Display of Totals and Subtotals
- Sorting Grouped Data
- Filtering Results
- Aggregating Multiple Columns (Adjacent and Non-Adjacent)
- Multiple Aggregations on a Single Dataset
- Handling Comma-Separated Text Strings
- Auto-Formatting GROUPBY Results with Conditional Formatting
- Troubleshooting GROUPBY Function Issues
The Excel GROUPBY Function
The GROUPBY function efficiently groups and aggregates data rows based on values in one or more columns. It also supports sorting and filtering of grouped data. As a dynamic array function, it returns multiple results, spilling into adjacent cells. The output resembles a pivot table without the formatting; the spill range dynamically recalculates with data changes. This is particularly beneficial for large datasets requiring summarized data through functions like SUM, AVERAGE, or COUNT.

Note: GROUPBY is similar to PIVOTBY, but GROUPBY exclusively groups data in rows.
Function Syntax
GROUPBY(row_fields, values, function, [field_headers], [total_depth], [sort_order], [filter_array])
Seven arguments are available, but only the first three are mandatory:
-
row_fields(required): The range of values to group by. -
values(required): The values to aggregate. -
function(required): The aggregation function (e.g.,SUM,AVERAGE,COUNT,MIN,MAX). -
field_headers(optional): Controls header display (0: No headers, 1: Yes, but don't show, 2: No headers, but generate, 3: Yes, and show). -
total_depth(optional): Controls total/subtotal display (0: No totals, 1: Grand total at bottom, 2: Grand and subtotals at bottom, -1: Grand total at top, -2: Grand and subtotals at top). -
sort_order(optional): Sorts by column index (positive for ascending, negative for descending). Arrays allow multi-column sorting. -
filter_array(optional): Filters rows using a Boolean array.
Usage Tips
- Dynamic Updates: The formula dynamically adjusts to dataset changes within its range. Adding new rows requires including them in the argument ranges or using an Excel table for automatic expansion.
-
Header Detection: If
field_headersis omitted, Excel infers headers based on thevaluesargument (text followed by a number suggests headers). -
Range Consistency:
row_fieldsandvaluesmust have equal lengths to avoid#VALUE!errors. - Conditional Formatting: Enhance readability by using conditional formatting to highlight totals and subtotals.
Note: GROUPBY is under development; thorough testing is recommended.
GROUPBY Function Availability
Currently available in Excel for Microsoft 365 (Insider Beta Channel).
Basic GROUPBY Formula
Let's assume a dataset with project names (Column A), types (Column B), and revenues (Column C). To summarize revenues by project type:
=GROUPBY(B2:B32, C2:C32, SUM)
This yields a list of unique project types with their revenue sums. Defaults are used for optional arguments (no headers, ascending sort, grand total at bottom).

Advanced GROUPBY Formula Examples
This section expands on the basic example, demonstrating the function's versatility.
Choosing the Aggregation Function
GROUPBY supports 16 aggregation functions, including standard functions (SUM, AVERAGE, COUNT, etc.) and specialized ones (PERCENTOF, ARRAYTOTEXT). These are eta-reduced lambdas, simplifying usage. Custom lambda functions are also supported. Multiple aggregations are possible using vectors (vertical for column stacking, horizontal for row stacking).
Displaying Headers
Use the field_headers argument (set to 3) to include headers in the output.
=GROUPBY(B2:B32, C2:C32, SUM, 3)

Grouping by Multiple Columns
Include a multi-column range in row_fields to group by multiple columns. For example, grouping by project type and status:
=GROUPBY(B2:C32, D2:D32, COUNT)

Grouping by Non-Adjacent Columns
Use CHOOSECOLS to select non-adjacent columns for grouping:
=GROUPBY(CHOOSECOLS(A2:D32, 2, 4), C2:C32, COUNT)

Controlling Totals and Subtotals
Use total_depth to control total/subtotal display. Setting it to 2 shows both grand and subtotals.
=GROUPBY(B2:C32, D2:D32, SUM, 3, 2)

Sorting Grouped Rows
Use sort_order for custom sorting (positive for ascending, negative for descending). Arrays enable multi-column sorting.
=GROUPBY(B2:B32, C2:C32, SUM, , , 2) (Sorts by values)

=GROUPBY(B2:C32, D2:D32, SUM, , , {-1,2}) (Multi-column sort)

Filtering Results
Use filter_array (Boolean array) to filter rows.
=GROUPBY(B2:B32, C2:C32, SUM, , , , B2:B32<>"Design")

Aggregating Multiple Columns
Aggregate adjacent columns directly:
=GROUPBY(B2:B32, D2:E32, AVERAGE, 3)

For non-adjacent columns, use CHOOSECOLS:
=GROUPBY(B2:B32, CHOOSECOLS(C2:E32, 1, 3), AVERAGE, 3)

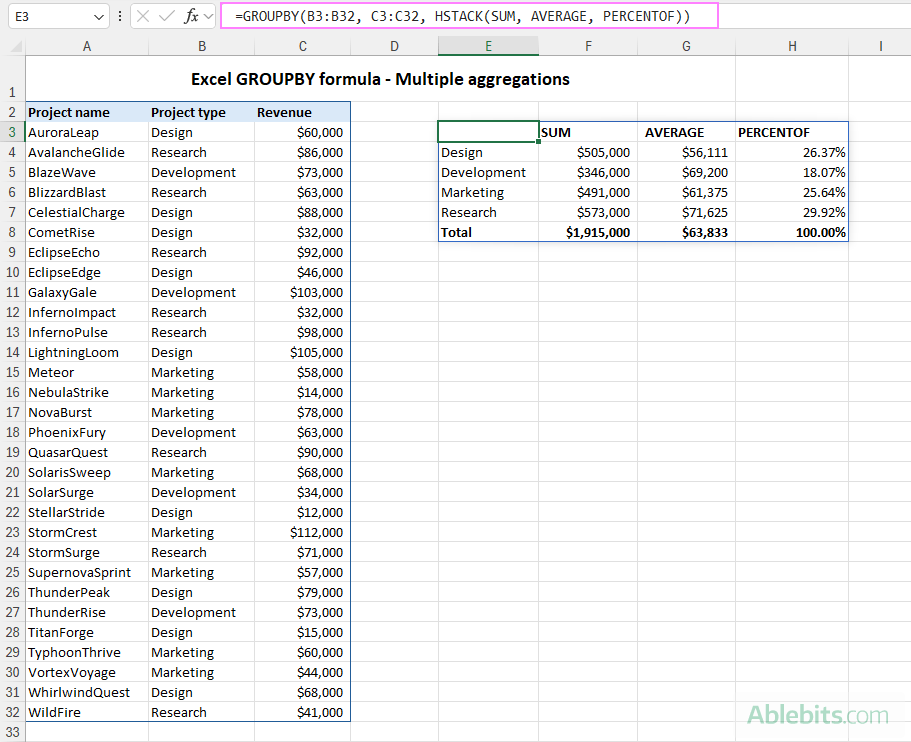
Multiple Aggregations on the Same Data
Use HSTACK or VSTACK for multiple aggregations:
=GROUPBY(B3:B32, C3:C32, HSTACK(SUM, AVERAGE, PERCENTOF))
=GROUPBY(B3:B32, C3:C32, VSTACK(SUM, AVERAGE, MIN, MAX),, 0)

Grouping Comma-Separated Text Values
Use ARRAYTOTEXT to group comma-separated text:
=GROUPBY(B3:B23, A3:A23, ARRAYTOTEXT, 0, 0)

Conditional Formatting of GROUPBY Results
Enhance visual clarity using conditional formatting to highlight headers, totals, and subtotals.
Troubleshooting GROUPBY Function Issues
- Function Unavailability: Ensure you have a Microsoft 365 subscription and the latest updates.
-
#VALUE!Error: Check for equal lengths inrow_fieldsandvaluesarguments, and ensure correctfilter_arraylength. Also, verify thattotal_depthis appropriate for the number of columns inrow_fields. -
#SPILL!Error: Clear adjacent cells to allow spill range.
In conclusion, the GROUPBY function significantly enhances Excel's data analysis capabilities, providing a powerful and efficient tool for various data manipulation tasks. With practice, you'll unlock its full potential for insightful data analysis.
Atas ialah kandungan terperinci Excel Groupby berfungsi untuk kumpulan kumpulan dan nilai agregat. Untuk maklumat lanjut, sila ikut artikel berkaitan lain di laman web China PHP!

Alat AI Hot

Undresser.AI Undress
Apl berkuasa AI untuk mencipta foto bogel yang realistik

AI Clothes Remover
Alat AI dalam talian untuk mengeluarkan pakaian daripada foto.

Undress AI Tool
Gambar buka pakaian secara percuma

Clothoff.io
Penyingkiran pakaian AI

Video Face Swap
Tukar muka dalam mana-mana video dengan mudah menggunakan alat tukar muka AI percuma kami!

Artikel Panas
Alat panas

Notepad++7.3.1
Editor kod yang mudah digunakan dan percuma

SublimeText3 versi Cina
Versi Cina, sangat mudah digunakan

Hantar Studio 13.0.1
Persekitaran pembangunan bersepadu PHP yang berkuasa

Dreamweaver CS6
Alat pembangunan web visual

SublimeText3 versi Mac
Perisian penyuntingan kod peringkat Tuhan (SublimeText3)
Topik panas


 Formula Excel untuk mencari nilai teratas 3, 5, 10 dalam lajur atau baris
Apr 01, 2025 am 05:09 AM
Formula Excel untuk mencari nilai teratas 3, 5, 10 dalam lajur atau baris
Apr 01, 2025 am 05:09 AM
Tutorial ini menunjukkan bagaimana untuk mencari nilai N atas dalam dataset dan mengambil data yang berkaitan dengan menggunakan formula Excel. Sama ada anda memerlukan kriteria tertentu, terendah, atau mereka yang memenuhi kriteria tertentu, panduan ini menyediakan penyelesaian. Findi
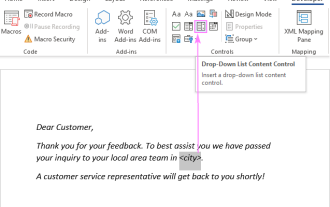 Tambahkan senarai dropdown ke templat e -mel Outlook
Apr 01, 2025 am 05:13 AM
Tambahkan senarai dropdown ke templat e -mel Outlook
Apr 01, 2025 am 05:13 AM
Tutorial ini menunjukkan kepada anda bagaimana untuk menambah senarai dropdown ke templat e -mel Outlook anda, termasuk pelbagai pilihan dan populasi pangkalan data. Walaupun Outlook tidak secara langsung menyokong dropdowns, panduan ini menyediakan penyelesaian kreatif. Templat e -mel SAV
 Cara menggunakan flash isi excel dengan contoh
Apr 05, 2025 am 09:15 AM
Cara menggunakan flash isi excel dengan contoh
Apr 05, 2025 am 09:15 AM
Tutorial ini menyediakan panduan komprehensif untuk ciri pengisian kilat Excel, alat yang berkuasa untuk mengautomasikan tugas kemasukan data. Ia meliputi pelbagai aspek, dari definisi dan lokasinya untuk penggunaan dan penyelesaian masalah lanjutan. Memahami Fla Excel
 Cara Menambah Kalendar Ke Outlook: Dikongsi, Kalendar Internet, Fail ICAL
Apr 03, 2025 am 09:06 AM
Cara Menambah Kalendar Ke Outlook: Dikongsi, Kalendar Internet, Fail ICAL
Apr 03, 2025 am 09:06 AM
Artikel ini menerangkan cara mengakses dan menggunakan kalendar bersama dalam aplikasi desktop Outlook, termasuk mengimport fail icalendar. Sebelum ini, kami meliputi berkongsi kalendar Outlook anda. Sekarang, mari kita meneroka bagaimana melihat kalendar yang dikongsi bersama
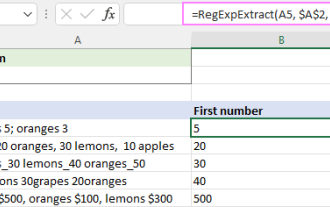 Regex untuk mengekstrak rentetan dalam Excel (satu atau semua perlawanan)
Mar 28, 2025 pm 12:19 PM
Regex untuk mengekstrak rentetan dalam Excel (satu atau semua perlawanan)
Mar 28, 2025 pm 12:19 PM
Dalam tutorial ini, anda akan belajar bagaimana menggunakan ungkapan biasa dalam Excel untuk mencari dan mengekstrak substrings yang sepadan dengan corak yang diberikan. Microsoft Excel menyediakan beberapa fungsi untuk mengekstrak teks dari sel. Fungsi -fungsi itu dapat mengatasi kebanyakan
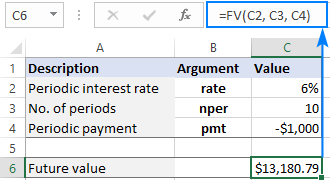 Fungsi FV dalam Excel untuk mengira nilai masa depan
Apr 01, 2025 am 04:57 AM
Fungsi FV dalam Excel untuk mengira nilai masa depan
Apr 01, 2025 am 04:57 AM
Tutorial ini menerangkan cara menggunakan fungsi FV Excel untuk menentukan nilai masa depan pelaburan, merangkumi kedua-dua pembayaran biasa dan deposit sekaligus. Perancangan kewangan yang berkesan bergantung kepada pemahaman pertumbuhan pelaburan, dan panduan ini terbukti
 Formula Median di Excel - Contoh Praktikal
Apr 11, 2025 pm 12:08 PM
Formula Median di Excel - Contoh Praktikal
Apr 11, 2025 pm 12:08 PM
Tutorial ini menerangkan cara mengira median data berangka dalam Excel menggunakan fungsi median. Median, ukuran utama kecenderungan pusat, mengenal pasti nilai pertengahan dalam dataset, yang menawarkan perwakilan yang lebih mantap dari Tenden Central
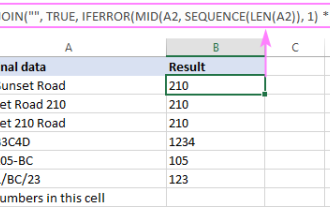 Cara membuang / memecah teks dan nombor dalam sel excel
Apr 01, 2025 am 05:07 AM
Cara membuang / memecah teks dan nombor dalam sel excel
Apr 01, 2025 am 05:07 AM
Tutorial ini menunjukkan beberapa kaedah untuk memisahkan teks dan nombor dalam sel Excel, menggunakan kedua-dua fungsi terbina dalam dan fungsi VBA tersuai. Anda akan belajar bagaimana untuk mengekstrak nombor semasa mengeluarkan teks, mengasingkan teks semasa membuang nombor
