
这篇文章主要介绍了echart简介,小编觉得挺不错的,现在分享给大家,也给大家做个参考。一起跟随小编过来看看吧
1. 插件的下载
以下是ECharts的下载链接,需要注意的是ECharts内部也是依赖于另一个插件的叫ZRender,当然对于大部分图表而言不需要ZRender的,但是对于地图控件及其他复杂的呈现控件而已都是需要ZRender的。为了避免不要的问题出现,建议大家在下载ECharts时同时也要下载ZRender。
ECharts下载地址: http://echarts.baidu.com/
ZRender下载地址:http://ecomfe.github.io/zrender/index.html
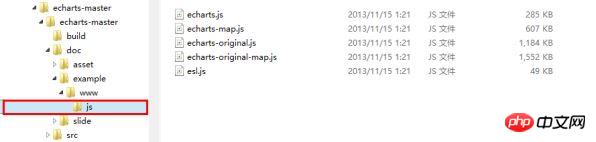
下载之后解压各自的文件目录结构如下:
ECharts:
ZRender:

2. 插件的引用
首先,新建一个Web应用程序,然后添加刚刚下载的文件,具体的目录结构如下:

这里有以下几点需要说明:
所有的跟ECharts有关的文件全部都在echarts文件夹下
echarts文件夹的内容分为两部分
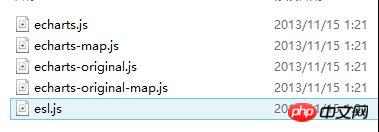
1) 一部分是以echarts开头的js文件,这些文件全部来自于1.中的ECharts文件目录中的js文件夹下的文件,也就是1.中的图中红框标注的js下的文件。如下:
2)另一部分是一个名为zrender的文件夹,这里需要特别注意的是该文件夹的命名必须为zrender,因为在echarts的js文件中对zrender的引用都是以zrender为根目录的,zrender文件夹的内容即为1.中zrender文件目录中的src文件夹下的内容,如下:

3. 在页面中的具体使用
按照上边的步骤配置过之后,我们就可以在页面中引用了,这里我主要是演示地图控件的使用方式,因为地图的引用跟其他的基本图形的引用不太一样。其他的图形的呈现也会做一个简要的演示。
MapChart
首先在跟2中的echarts文件夹同一个目录(也就是Modules文件夹)下添加一个aspx页或html页,需要注意的是,如果是在aspx页中使用echarts时,需要把要渲染的p放在form标签之外,否则图形是显示不出来的。
在head标签中添加对echarts的引用如下:
1 2 3 4 |
|
在body标记中,form标记之外,添加一个p,用来做图表渲染的容器。如下:
1 2 3 4 5 6 7 8 9 |
|
在上面中添加的p标记下,添加如下的js代码段,如下:
1 2 3 4 5 6 7 8 9 10 11 12 13 14 15 16 17 18 19 20 21 22 23 24 25 26 27 28 29 30 31 32 33 34 35 36 37 38 39 40 41 42 43 44 45 46 47 48 49 50 51 52 53 54 55 56 57 58 59 60 61 62 63 64 65 66 67 68 69 70 71 72 73 74 75 76 77 78 79 80 81 82 83 84 85 86 87 88 89 90 91 92 93 94 95 96 97 98 99 100 101 102 103 104 105 106 107 108 109 110 111 112 113 114 115 116 117 118 119 120 121 122 123 124 125 126 127 128 129 130 131 132 133 134 135 136 137 138 139 140 141 142 143 144 145 146 147 148 149 150 151 152 153 154 155 156 157 158 159 160 161 162 163 164 165 166 167 168 169 170 171 172 173 174 175 176 177 178 179 180 181 182 183 184 185 186 187 188 189 190 191 192 193 194 195 196 197 198 199 200 201 202 203 204 205 206 207 208 209 210 211 212 213 214 215 216 217 218 219 220 221 222 223 224 225 226 227 228 229 230 231 232 233 234 235 236 237 238 239 240 241 242 243 244 245 246 247 248 249 250 251 252 253 254 255 256 257 258 259 260 261 262 263 264 265 266 267 268 269 270 271 272 273 274 275 276 277 278 279 280 281 282 283 284 285 286 287 288 289 290 291 292 293 294 295 296 297 298 299 300 301 302 303 304 305 306 307 308 309 310 311 312 313 314 315 316 317 318 319 320 321 |
|
完成以上操作之后,效果如下图所示:

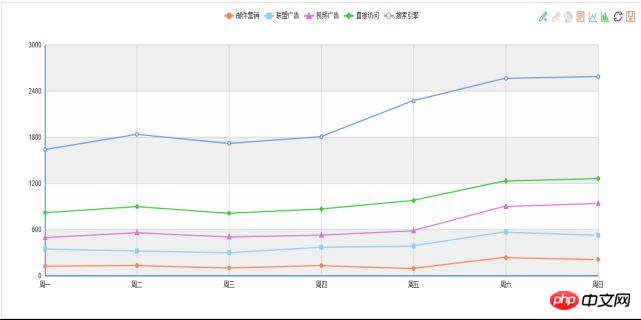
LineChart
除了地图图表之外的其他的图标的使用方式都差不多。事实上其他的图表跟地图图表的区别在于对配置文件的引用。这里只做一个折线图的示例,其它的示例都是一样的。
1 2 3 4 5 6 7 8 9 10 11 12 13 14 15 16 17 18 19 20 21 22 23 24 25 26 27 28 29 30 31 32 33 34 35 36 37 38 39 40 41 42 43 44 45 46 47 48 49 50 51 52 53 54 55 56 57 58 59 60 61 62 63 64 65 66 67 68 69 70 71 72 73 74 75 76 77 78 79 80 81 82 83 84 85 86 87 88 89 90 91 92 93 94 95 96 97 98 99 100 101 102 103 104 105 106 107 108 109 110 111 112 113 114 115 116 117 118 119 120 121 122 123 124 125 126 127 128 129 130 131 132 133 134 135 136 137 138 139 140 141 142 143 144 145 146 147 148 149 150 151 152 153 154 155 156 157 158 159 160 161 162 163 164 165 166 167 168 169 170 171 172 173 174 175 176 177 178 179 180 181 182 183 184 185 186 187 188 189 190 191 192 193 194 195 196 197 198 199 200 201 202 203 204 205 206 207 208 209 210 211 212 213 214 215 216 217 218 219 220 221 222 223 224 225 226 227 228 229 230 231 232 233 234 235 236 237 238 239 240 241 242 243 244 245 246 247 248 249 250 251 252 253 254 255 256 257 258 259 260 261 262 263 264 265 266 267 268 269 270 271 272 273 274 275 276 277 278 279 280 281 282 283 284 285 286 287 288 289 290 291 292 293 294 295 296 297 298 299 300 301 302 303 304 305 306 307 308 309 310 311 312 313 314 315 316 317 318 319 320 321 322 323 324 325 326 327 328 329 330 331 332 333 334 335 336 337 338 339 340 341 342 343 344 345 346 347 348 349 350 351 352 353 354 355 356 357 358 359 360 361 362 363 364 365 366 367 368 369 370 371 372 373 374 375 376 377 378 379 380 381 382 383 384 385 386 387 388 389 390 391 392 393 394 395 396 397 398 399 400 401 402 403 404 405 406 407 408 409 410 411 412 413 414 415 416 417 418 419 420 421 422 423 424 425 426 427 428 429 430 431 432 433 434 435 436 437 438 439 440 441 442 443 444 445 446 447 448 449 450 451 452 453 454 455 456 457 458 459 460 461 462 463 464 465 466 467 468 469 470 471 472 473 474 475 476 477 478 479 480 481 482 483 484 485 486 487 488 489 490 491 492 493 494 495 496 497 498 499 500 501 502 503 504 505 506 507 508 |
|
完成以上操作之后效果图如下:
Atas ialah kandungan terperinci echart插件等基本使用介绍. Untuk maklumat lanjut, sila ikut artikel berkaitan lain di laman web China PHP!
 Kaedah input rujukan mutlak
 Telefon mudah alih manakah yang disokong oleh OS Hongmeng?
 Apakah maksud sambungan fail biasanya?
 rentetan padanan ungkapan biasa java
 Bagaimana untuk mengeksport projek dalam phpstorm
 Bagaimana untuk menetapkan ketelusan dalam CSS
 Memori yang boleh bertukar maklumat secara terus dengan CPU ialah a
 Apakah maksudnya komputer tidak disokong?
 git pull pulls code


![[Web front-end] Permulaan pantas Node.js](https://img.php.cn/upload/course/000/000/067/662b5d34ba7c0227.png)


