

使用XHProf查找PHP性能瓶颈的实例_php实例

下面小编就为大家分享一篇使用XHProf查找PHP性能瓶颈的实例,XHProf是facebook 开发的一个测试php性能的扩展,本文记录了在PHP应用中使用XHProf对PHP进行性能优化,查找性能瓶颈的方法。具有很好的参考价值,希望对大家有所帮助。一起跟随小编过来看看吧!
一、安装Xhprof扩展
//github上下载https://github.com/facebook/xhprof
unzip xhprof-master.zip
cd xhprof-master/extension/
/usr/local/php/bin/phpize
./configure --with-php-config=/usr/local/php/bin/php-config --enable-xhprof
make && make install
二、修改php.ini
[xhprof]
extension=xhprof.so
xhprof.output_dir=/tmp
配置中xhprof.output_dir指定了生成的profile文件存储的位置,我们将其指定为/tmp。
三、将相关文件移动项目中
//xhprof下载压缩包中的xhprof_html和xhprof_lib
cp -r xhprof-master/xhprof_html /usr/local/nginx/html/xhprof/
cp -r xhprof-master/xhprof_lib /usr/local/nginx/html/xhprof/
配置一个域名,浏览器可以访问到 http://will.com/xhprof/xhprof_html/index.php
server{
 listen 80;
 server_name will.com;
 location / {
  root /usr/local/nginx/html;
  index index.html;
 }
 location ~ \.php$ {
  root html;
  fastcgi_pass 127.0.0.1:9000;
  fastcgi_index index.php;
  fastcgi_param SCRIPT_FILENAME $document_root$fastcgi_script_name;
  include  fastcgi_params;
 }
}四、安装graphivz
//需要安装graphviz否则查看性能图片时候会报failed to execute cmd: " dot -Tpng". stderr: `sh: dot: command not found '
yum -y install graphviz
五、编写测试文件
//入口文件的开始位置
xhprof_enable(XHPROF_FLAGS_MEMORY | XHPROF_FLAGS_CPU);

业务逻辑...

//业务逻辑结束后
$xhprof_data = xhprof_disable();
include_once "/usr/local/nginx/html/xhprof/xhprof_lib/utils/xhprof_lib.php";
include_once "/usr/local/nginx/html/xhprof/xhprof_lib/utils/xhprof_runs.php";
$objXhprofRun = new XHProfRuns_Default();//数据会保存在php.ini中xhprof.output_dir设置的目录去中
$run_id = $objXhprofRun->save_run($xhprof_data, "test");
完整代码示例(随机满减红包demo)
<?php
xhprof_enable(XHPROF_FLAGS_MEMORY | XHPROF_FLAGS_CPU);
function show($info)
{
echo "<pre class="brush:php;toolbar:false">";
print_r($info);
}
//不作数据校验
$rules = array(
2=>array('min'=>1, 'max'=>10, 'chance'=>30),//金额:分 概率:百分之(默认为100%,不足100%按第一档计算)
array('min'=>11, 'max'=>25, 'chance'=>60),
array('min'=>26, 'max'=>50, 'chance'=>10),
array('min'=>50, 'max'=>80, 'chance'=>0),
array('min'=>80, 'max'=>100, 'chance'=>0),
);
$total_money = 10000;//红包总金额
$res = array();
while($total_money>0)
{
$index = getLevel($rules);
$money = setMoney($rules, $index);
if ($money > $total_money)//金额不足
{
$money = $total_money;
$total_money = 0;
} else {
$total_money -= $money;
}
$res[] = ($index+1)."---".$money;
}
echo show($res);
echo $total_money . "<br/>";
//1.先确定档次
function getLevel($rules)
{
$level = array();
$chance = 0;
foreach($rules as $k=>$v)
{
if ($v['chance']>0)
{
$chance += $v['chance']*100;//扩大100倍
$level[$k] = $chance;
}
}
$index = 0;
$rand_num = mt_rand(1, 10000);
foreach($level as $k=>$v)
{
if ($rand_num <= $v)
{
$index = $k;
break;
}
}
return $index;
}
//2.确定档次之后,再确定金额
function setMoney($rules, $index)
{
$money = mt_rand($rules[$index]['min']*10000, $rules[$index]['max']*10000)/10000;
$money = ceil($money);
$money > 1 && $money = $money -1;//防止出现免单情况
return $money;
}
$xhprof_data = xhprof_disable();
include_once "/usr/local/nginx/html/xhprof/xhprof_lib/utils/xhprof_lib.php";
include_once "/usr/local/nginx/html/xhprof/xhprof_lib/utils/xhprof_runs.php";
$objXhprofRun = new XHProfRuns_Default();//数据会保存在php.ini中xhprof.output_dir设置的目录去中
$run_id = $objXhprofRun->save_run($xhprof_data, "test");
echo "http://will.com/xhprof/xhprof_html/index.php?run=$run_id&source=test";//变量$runId是本次请求生成分析结果的id,最后我们输出了一个链接地址,使用改地址就可以看到本次请求的分析结果。六、查看分析结果
先运行业务代码;
然后浏览器打开 http://will.com/xhprof/xhprof_html/index.php, 点击最后一次生成xhprof文件
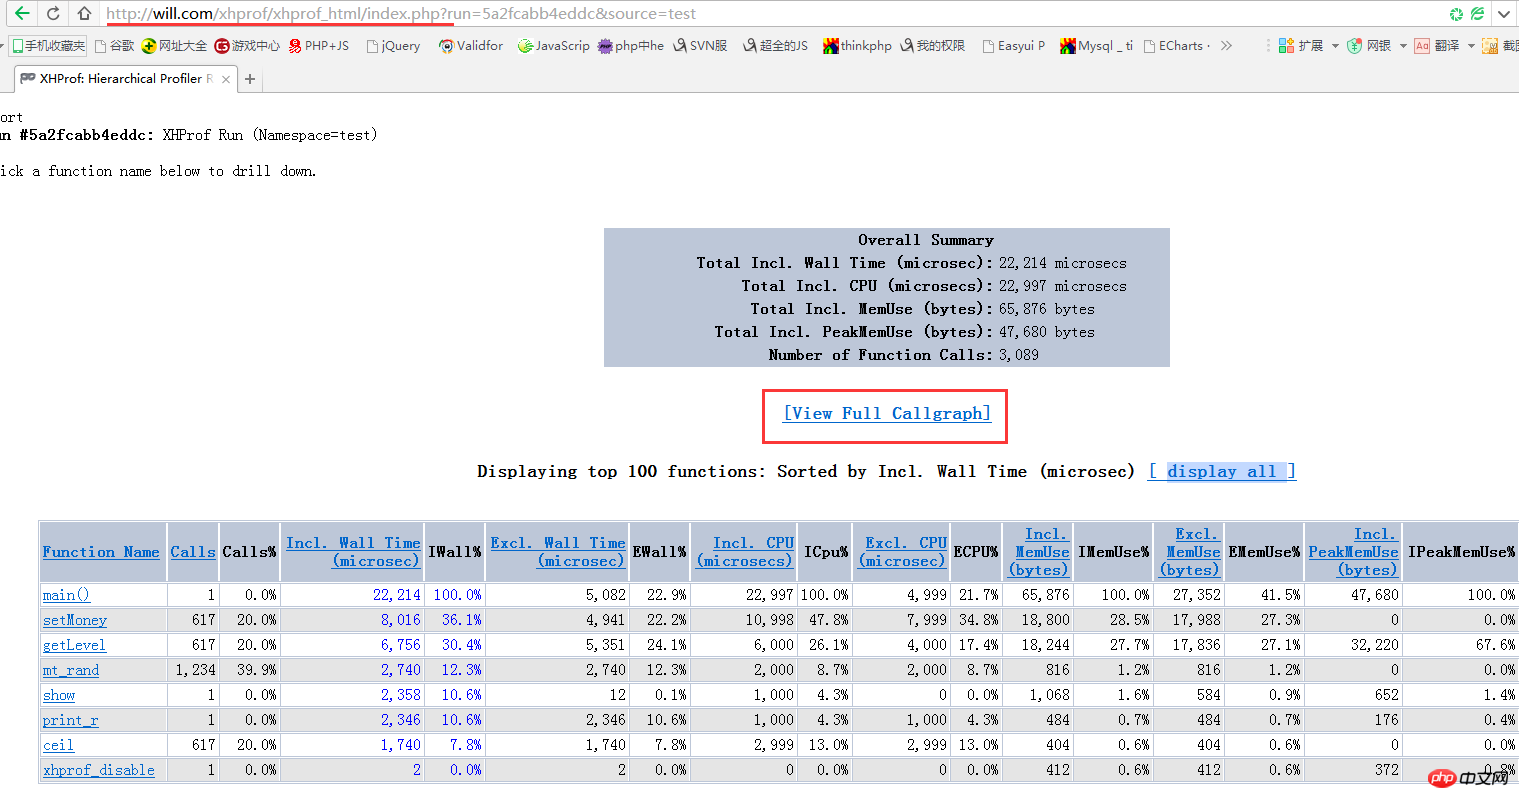
注意到中间的<span style="font-family:NSimsun">View Full Callgraph</span>链接,通过该链接我们可以看到图形化的分析结果
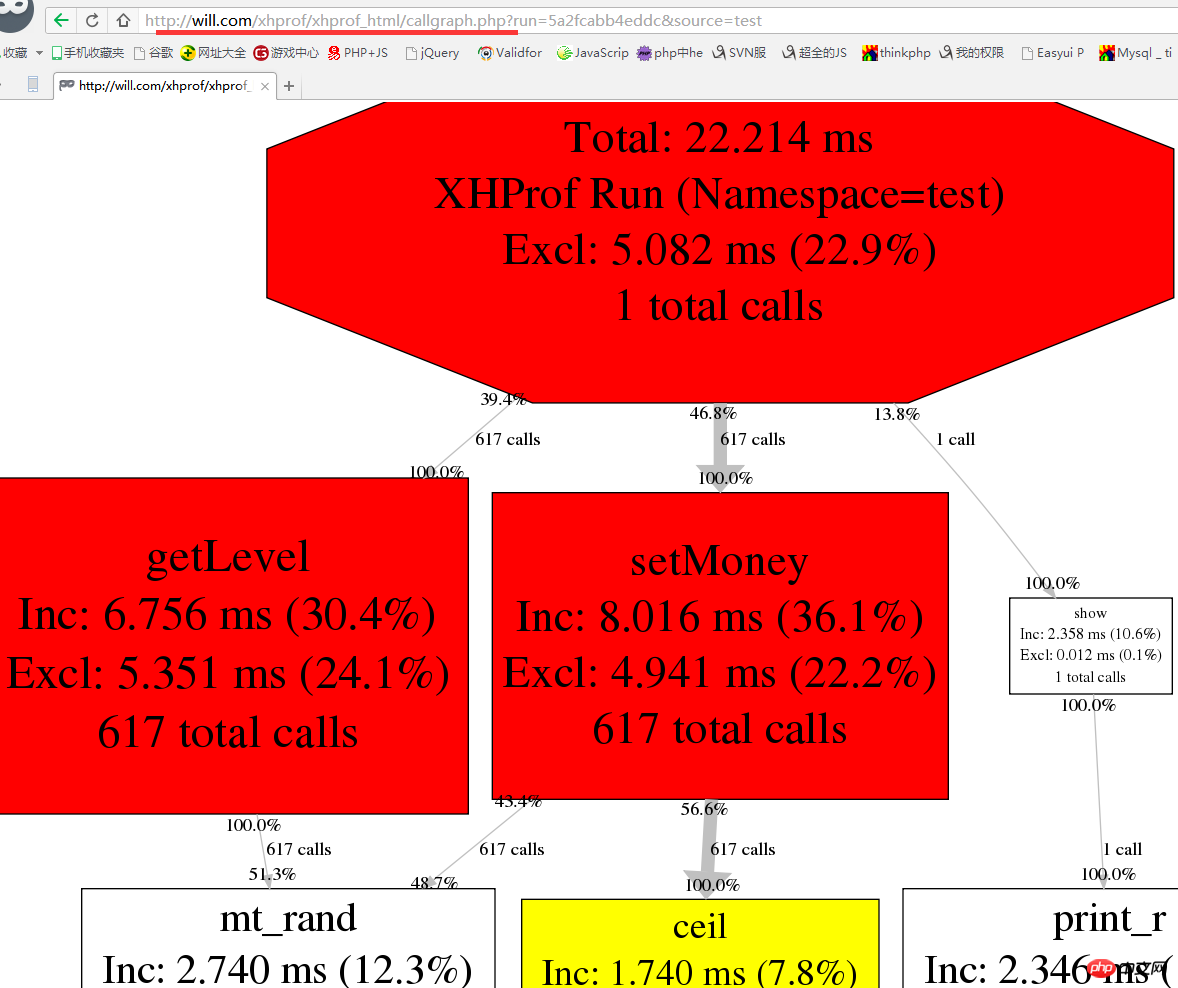
图中红色的部分为性能比较低,耗时比较长的部分,我们可以根据根据哪些函数被标记为红色对系统的代码进行优化
另外附上, xhprof报告字段含义:
Function Name:方法名称。
Calls:方法被调用的次数。
Calls%:方法调用次数在同级方法总数调用次数中所占的百分比。
Incl.Wall Time(microsec):方法执行花费的时间,包括子方法的执行时间。(单位:微秒)
IWall%:方法执行花费的时间百分比。
Excl. Wall Time(microsec):方法本身执行花费的时间,不包括子方法的执行时间。(单位:微秒)
EWall%:方法本身执行花费的时间百分比。
Incl. CPU(microsecs):方法执行花费的CPU时间,包括子方法的执行时间。(单位:微秒)
ICpu%:方法执行花费的CPU时间百分比。
Excl. CPU(microsec):方法本身执行花费的CPU时间,不包括子方法的执行时间。(单位:微秒)
ECPU%:方法本身执行花费的CPU时间百分比。
Incl.MemUse(bytes):方法执行占用的内存,包括子方法执行占用的内存。(单位:字节)
IMemUse%:方法执行占用的内存百分比。
Excl.MemUse(bytes):方法本身执行占用的内存,不包括子方法执行占用的内存。(单位:字节)
EMemUse%:方法本身执行占用的内存百分比。
Incl.PeakMemUse(bytes):Incl.MemUse峰值。(单位:字节)
IPeakMemUse%:Incl.MemUse峰值百分比。
Excl.PeakMemUse(bytes):Excl.MemUse峰值。单位:(字节)
EPeakMemUse%:Excl.MemUse峰值百分比。
以上这篇使用XHProf查找PHP性能瓶颈的实例就是小编分享给大家的全部内容了,希望能给大家一个参考!!
相关推荐:
php7下xhprof性能分析工具的安装与使用的图文代码教程
Atas ialah kandungan terperinci 使用XHProf查找PHP性能瓶颈的实例_php实例. Untuk maklumat lanjut, sila ikut artikel berkaitan lain di laman web China PHP!

Alat AI Hot

Undresser.AI Undress
Apl berkuasa AI untuk mencipta foto bogel yang realistik

AI Clothes Remover
Alat AI dalam talian untuk mengeluarkan pakaian daripada foto.

Undress AI Tool
Gambar buka pakaian secara percuma

Clothoff.io
Penyingkiran pakaian AI

AI Hentai Generator
Menjana ai hentai secara percuma.

Artikel Panas
Alat panas

Notepad++7.3.1
Editor kod yang mudah digunakan dan percuma

SublimeText3 versi Cina
Versi Cina, sangat mudah digunakan

Hantar Studio 13.0.1
Persekitaran pembangunan bersepadu PHP yang berkuasa

Dreamweaver CS6
Alat pembangunan web visual

SublimeText3 versi Mac
Perisian penyuntingan kod peringkat Tuhan (SublimeText3)
Topik panas


 Konfigurasi Projek CakePHP
Sep 10, 2024 pm 05:25 PM
Konfigurasi Projek CakePHP
Sep 10, 2024 pm 05:25 PM
Dalam bab ini, kita akan memahami Pembolehubah Persekitaran, Konfigurasi Umum, Konfigurasi Pangkalan Data dan Konfigurasi E-mel dalam CakePHP.
 Panduan Pemasangan dan Naik Taraf PHP 8.4 untuk Ubuntu dan Debian
Dec 24, 2024 pm 04:42 PM
Panduan Pemasangan dan Naik Taraf PHP 8.4 untuk Ubuntu dan Debian
Dec 24, 2024 pm 04:42 PM
PHP 8.4 membawa beberapa ciri baharu, peningkatan keselamatan dan peningkatan prestasi dengan jumlah penamatan dan penyingkiran ciri yang sihat. Panduan ini menerangkan cara memasang PHP 8.4 atau naik taraf kepada PHP 8.4 pada Ubuntu, Debian, atau terbitan mereka
 Tarikh dan Masa CakePHP
Sep 10, 2024 pm 05:27 PM
Tarikh dan Masa CakePHP
Sep 10, 2024 pm 05:27 PM
Untuk bekerja dengan tarikh dan masa dalam cakephp4, kami akan menggunakan kelas FrozenTime yang tersedia.
 Muat naik Fail CakePHP
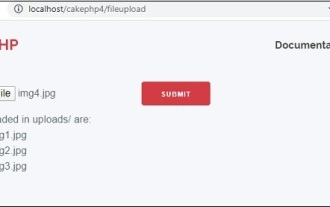
Sep 10, 2024 pm 05:27 PM
Muat naik Fail CakePHP
Sep 10, 2024 pm 05:27 PM
Untuk mengusahakan muat naik fail, kami akan menggunakan pembantu borang. Di sini, adalah contoh untuk muat naik fail.
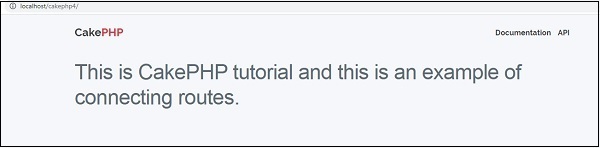 Penghalaan CakePHP
Sep 10, 2024 pm 05:25 PM
Penghalaan CakePHP
Sep 10, 2024 pm 05:25 PM
Dalam bab ini, kita akan mempelajari topik berikut yang berkaitan dengan penghalaan ?
 Bincangkan CakePHP
Sep 10, 2024 pm 05:28 PM
Bincangkan CakePHP
Sep 10, 2024 pm 05:28 PM
CakePHP ialah rangka kerja sumber terbuka untuk PHP. Ia bertujuan untuk menjadikan pembangunan, penggunaan dan penyelenggaraan aplikasi lebih mudah. CakePHP adalah berdasarkan seni bina seperti MVC yang berkuasa dan mudah difahami. Model, Pandangan dan Pengawal gu
 Cara Menyediakan Kod Visual Studio (Kod VS) untuk Pembangunan PHP
Dec 20, 2024 am 11:31 AM
Cara Menyediakan Kod Visual Studio (Kod VS) untuk Pembangunan PHP
Dec 20, 2024 am 11:31 AM
Kod Visual Studio, juga dikenali sebagai Kod VS, ialah editor kod sumber percuma — atau persekitaran pembangunan bersepadu (IDE) — tersedia untuk semua sistem pengendalian utama. Dengan koleksi sambungan yang besar untuk banyak bahasa pengaturcaraan, Kod VS boleh menjadi c
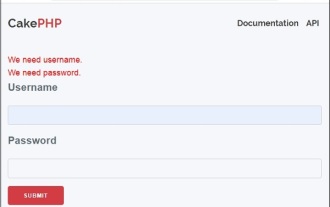 Pengesah Mencipta CakePHP
Sep 10, 2024 pm 05:26 PM
Pengesah Mencipta CakePHP
Sep 10, 2024 pm 05:26 PM
Pengesah boleh dibuat dengan menambah dua baris berikut dalam pengawal.
