jQuery插件echarts去掉垂直网格线用法详解
本文主要介绍了jQuery插件echarts去掉垂直网格线用法,结合实例形式对比分析了jQuery图标插件echarts针对垂直网格线的相关设置操作技巧,需要的朋友可以参考下,希望能帮助到大家。
1、问题背景
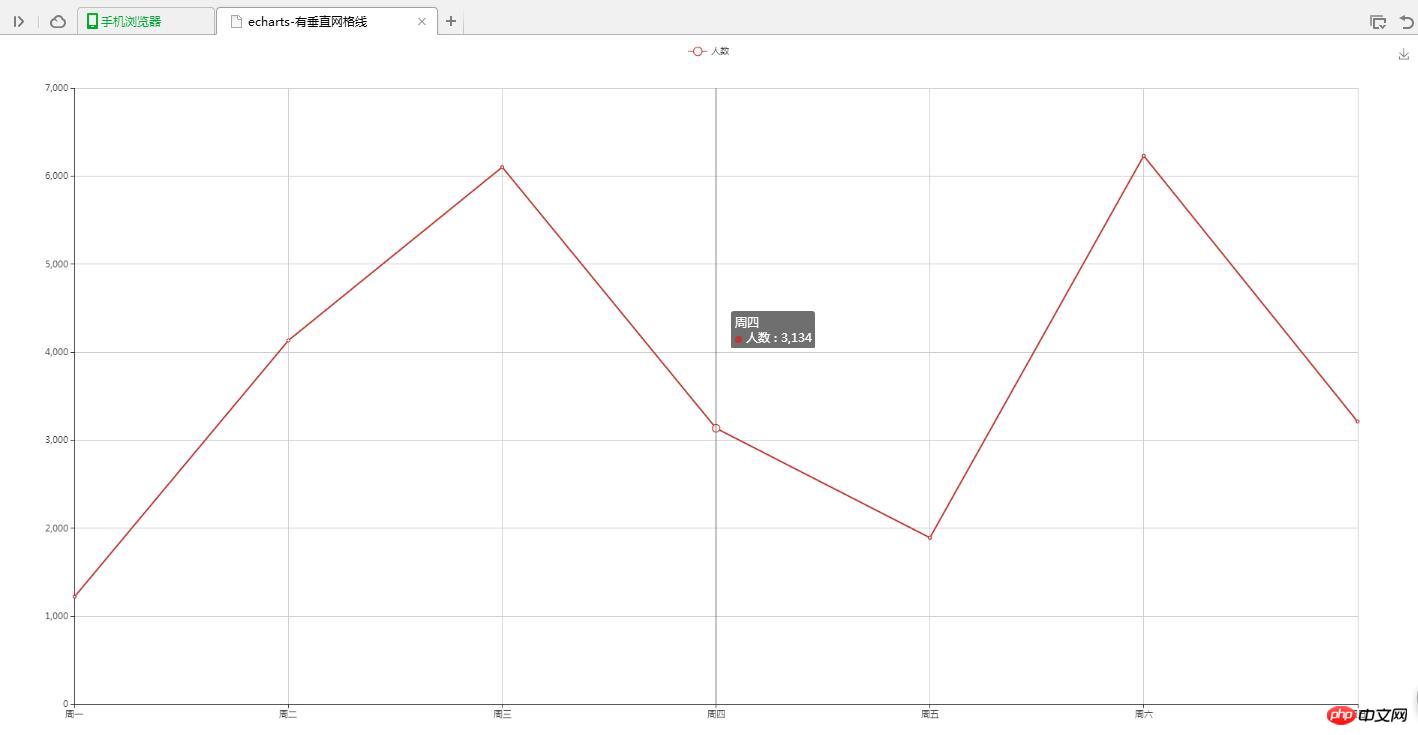
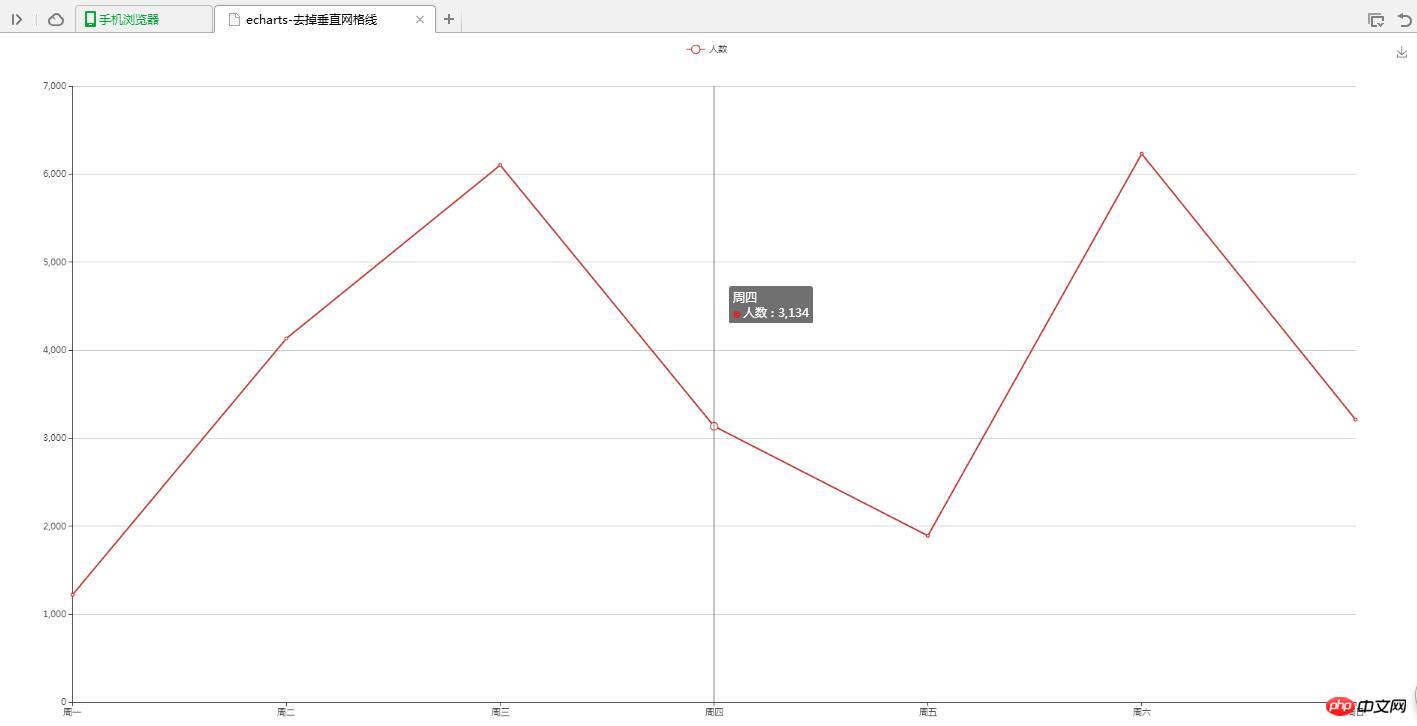
设计一条统计人数的折线,其中网格线没有垂直线
2、实现源码
(1)有垂直网格线
<!DOCTYPE html>
<html>
<head>
<meta charset="UTF-8">
<title>echarts-有垂直网格线</title>
<link rel="shortcut icon" href="../js/echarts-2.2.7/doc/asset/ico/favicon.png" rel="external nofollow" rel="external nofollow" >
<script type="text/javascript" src="../js/echarts-2.2.7/doc/asset/js/jquery.min.js" ></script>
<script type="text/javascript" src="../js/echarts-2.2.7/doc/example/www2/js/echarts-all.js" ></script>
<style>
body,html{
width: 99%;
height: 99%;
font-family: "微软雅黑";
font-size: 12px;
}
#chart{
width: 100%;
height: 100%;
}
</style>
<script>
$(function(){
var chart = document.getElementById('chart');
var echart = echarts.init(chart);
var option = {
title: {
text: ''
},
tooltip: {
trigger: 'axis'
},
legend: {
data:['人数']
},
grid: {
left: '3%',
right: '4%',
bottom: '3%',
containLabel: true
},
toolbox: {
feature: {
saveAsImage: {}
}
},
xAxis: {
type: 'category',
boundaryGap: false,
splitLine:{
show:true
},
data: ['周一','周二','周三','周四','周五','周六','周日']
},
yAxis: {
type: 'value'
},
series: [
{
name:'人数',
type:'line',
stack: '人数',
data:[1220, 4132, 6101, 3134, 1890, 6230, 3210]
}
]
};
echart.setOption(option);
});
</script>
</head>
<body>
<p id="chart"></p>
</body>
</html>(2)无垂直网格线
<!DOCTYPE html>
<html>
<head>
<meta charset="UTF-8">
<title>echarts-去掉垂直网格线</title>
<link rel="shortcut icon" href="../js/echarts-2.2.7/doc/asset/ico/favicon.png" rel="external nofollow" rel="external nofollow" >
<script type="text/javascript" src="../js/echarts-2.2.7/doc/asset/js/jquery.min.js" ></script>
<script type="text/javascript" src="../js/echarts-2.2.7/doc/example/www2/js/echarts-all.js" ></script>
<style>
body,html{
width: 99%;
height: 99%;
font-family: "微软雅黑";
font-size: 12px;
}
#chart{
width: 100%;
height: 100%;
}
</style>
<script>
$(function(){
var chart = document.getElementById('chart');
var echart = echarts.init(chart);
var option = {
title: {
text: ''
},
tooltip: {
trigger: 'axis'
},
legend: {
data:['人数']
},
grid: {
left: '3%',
right: '4%',
bottom: '3%',
containLabel: true
},
toolbox: {
feature: {
saveAsImage: {}
}
},
xAxis: {
type: 'category',
boundaryGap: false,
splitLine:{
show:false
},
data: ['周一','周二','周三','周四','周五','周六','周日']
},
yAxis: {
type: 'value'
},
series: [
{
name:'人数',
type:'line',
stack: '人数',
data:[1220, 4132, 6101, 3134, 1890, 6230, 3210]
}
]
};
echart.setOption(option);
});
</script>
</head>
<body>
<p id="chart"></p>
</body>
</html>3、实现结果
(1)有垂直网格线

(2)无垂直网格线

4、问题说明
去掉网格中的垂直线,只需在xAxis中加入splitLine属性的设置show:false
相关推荐:
Atas ialah kandungan terperinci jQuery插件echarts去掉垂直网格线用法详解. Untuk maklumat lanjut, sila ikut artikel berkaitan lain di laman web China PHP!

Alat AI Hot

Undresser.AI Undress
Apl berkuasa AI untuk mencipta foto bogel yang realistik

AI Clothes Remover
Alat AI dalam talian untuk mengeluarkan pakaian daripada foto.

Undress AI Tool
Gambar buka pakaian secara percuma

Clothoff.io
Penyingkiran pakaian AI

AI Hentai Generator
Menjana ai hentai secara percuma.

Artikel Panas

Alat panas

Notepad++7.3.1
Editor kod yang mudah digunakan dan percuma

SublimeText3 versi Cina
Versi Cina, sangat mudah digunakan

Hantar Studio 13.0.1
Persekitaran pembangunan bersepadu PHP yang berkuasa

Dreamweaver CS6
Alat pembangunan web visual

SublimeText3 versi Mac
Perisian penyuntingan kod peringkat Tuhan (SublimeText3)

Topik panas
 1378
1378
 52
52
 Penjelasan terperinci kaedah rujukan jQuery: Panduan permulaan cepat
Feb 27, 2024 pm 06:45 PM
Penjelasan terperinci kaedah rujukan jQuery: Panduan Mula Pantas jQuery ialah perpustakaan JavaScript yang popular yang digunakan secara meluas dalam pembangunan tapak web Ia memudahkan pengaturcaraan JavaScript dan menyediakan pemaju dengan fungsi dan ciri yang kaya. Artikel ini akan memperkenalkan kaedah rujukan jQuery secara terperinci dan menyediakan contoh kod khusus untuk membantu pembaca bermula dengan cepat. Memperkenalkan jQuery Pertama, kita perlu memperkenalkan perpustakaan jQuery ke dalam fail HTML. Ia boleh diperkenalkan melalui pautan CDN atau dimuat turun
 Bagaimana untuk menggunakan kaedah permintaan PUT dalam jQuery?
Feb 28, 2024 pm 03:12 PM
Bagaimana untuk menggunakan kaedah permintaan PUT dalam jQuery? Dalam jQuery, kaedah menghantar permintaan PUT adalah serupa dengan menghantar jenis permintaan lain, tetapi anda perlu memberi perhatian kepada beberapa butiran dan tetapan parameter. Permintaan PUT biasanya digunakan untuk mengemas kini sumber, seperti mengemas kini data dalam pangkalan data atau mengemas kini fail pada pelayan. Berikut ialah contoh kod khusus menggunakan kaedah permintaan PUT dalam jQuery. Mula-mula, pastikan anda memasukkan fail perpustakaan jQuery, kemudian anda boleh menghantar permintaan PUT melalui: $.ajax({u
 Analisis mendalam: kelebihan dan kekurangan jQuery
Feb 27, 2024 pm 05:18 PM
jQuery ialah perpustakaan JavaScript yang pantas, kecil dan kaya dengan ciri yang digunakan secara meluas dalam pembangunan bahagian hadapan. Sejak dikeluarkan pada tahun 2006, jQuery telah menjadi salah satu alat pilihan untuk banyak pembangun, tetapi dalam aplikasi praktikal, ia juga mempunyai beberapa kelebihan dan kekurangan. Artikel ini akan menyediakan analisis mendalam tentang kelebihan dan kekurangan jQuery dan menggambarkannya dengan contoh kod khusus. Kelebihan: 1. Sintaks ringkas Reka bentuk sintaks jQuery adalah ringkas dan jelas, yang boleh meningkatkan kebolehbacaan dan kecekapan menulis kod. sebagai contoh,
 Bagaimana untuk mengalih keluar atribut ketinggian elemen dengan jQuery?
Feb 28, 2024 am 08:39 AM
Bagaimana untuk mengalih keluar atribut ketinggian elemen dengan jQuery? Dalam pembangunan bahagian hadapan, kita sering menghadapi keperluan untuk memanipulasi atribut ketinggian elemen. Kadangkala, kita mungkin perlu menukar ketinggian unsur secara dinamik, dan kadangkala kita perlu mengalih keluar atribut ketinggian unsur. Artikel ini akan memperkenalkan cara menggunakan jQuery untuk mengalih keluar atribut ketinggian elemen dan memberikan contoh kod khusus. Sebelum menggunakan jQuery untuk mengendalikan atribut ketinggian, kita perlu terlebih dahulu memahami atribut ketinggian dalam CSS. Atribut ketinggian digunakan untuk menetapkan ketinggian elemen
 Petua jQuery: Cepat ubah suai teks semua teg pada halaman
Feb 28, 2024 pm 09:06 PM
Tajuk: Petua jQuery: Cepat ubah suai teks semua teg pada halaman Dalam pembangunan web, kita selalunya perlu mengubah suai dan mengendalikan elemen pada halaman. Apabila menggunakan jQuery, kadangkala anda perlu mengubah suai kandungan teks semua teg dalam halaman sekaligus, yang boleh menjimatkan masa dan tenaga. Berikut akan memperkenalkan cara menggunakan jQuery untuk mengubah suai teks semua teg pada halaman dengan cepat, dan memberikan contoh kod khusus. Pertama, kita perlu memperkenalkan fail perpustakaan jQuery dan memastikan bahawa kod berikut dimasukkan ke dalam halaman: <
 Gunakan jQuery untuk mengubah suai kandungan teks semua teg
Feb 28, 2024 pm 05:42 PM
Tajuk: Gunakan jQuery untuk mengubah suai kandungan teks semua teg jQuery ialah perpustakaan JavaScript yang popular yang digunakan secara meluas untuk mengendalikan operasi DOM. Dalam pembangunan web, kita sering menghadapi keperluan untuk mengubah suai kandungan teks tag pautan (tag) pada halaman. Artikel ini akan menerangkan cara menggunakan jQuery untuk mencapai matlamat ini dan memberikan contoh kod khusus. Pertama, kita perlu memperkenalkan perpustakaan jQuery ke dalam halaman. Tambahkan kod berikut dalam fail HTML:
 Bagaimana untuk mengetahui sama ada elemen jQuery mempunyai atribut tertentu?
Feb 29, 2024 am 09:03 AM
Bagaimana untuk mengetahui sama ada elemen jQuery mempunyai atribut tertentu? Apabila menggunakan jQuery untuk mengendalikan elemen DOM, anda sering menghadapi situasi di mana anda perlu menentukan sama ada sesuatu elemen mempunyai atribut tertentu. Dalam kes ini, kita boleh melaksanakan fungsi ini dengan mudah dengan bantuan kaedah yang disediakan oleh jQuery. Berikut akan memperkenalkan dua kaedah yang biasa digunakan untuk menentukan sama ada elemen jQuery mempunyai atribut khusus, dan melampirkan contoh kod tertentu. Kaedah 1: Gunakan kaedah attr() dan operator jenis // untuk menentukan sama ada elemen mempunyai atribut tertentu
 Fahami peranan dan senario aplikasi eq dalam jQuery
Feb 28, 2024 pm 01:15 PM
jQuery ialah perpustakaan JavaScript popular yang digunakan secara meluas untuk mengendalikan manipulasi DOM dan pengendalian acara dalam halaman web. Dalam jQuery, kaedah eq() digunakan untuk memilih elemen pada kedudukan indeks tertentu Senario penggunaan dan aplikasi khusus adalah seperti berikut. Dalam jQuery, kaedah eq() memilih elemen pada kedudukan indeks yang ditentukan. Kedudukan indeks mula dikira dari 0, iaitu indeks elemen pertama ialah 0, indeks elemen kedua ialah 1, dan seterusnya. Sintaks kaedah eq() adalah seperti berikut: $("s


