

详细解读plotly.js 绘图库使用教程(详细教程)
本篇文章主要介绍了详解plotly.js 绘图库入门使用教程,现在分享给大家,也给大家做个参考。
本文介绍了plotly.js 绘图库入门使用教程,分享给大家,具体如下:
Plotly
缘起
这两天想在前端展现数学函数图像,猜测应该有成熟的 js 库。
于是,简单的进行了尝试。
最后决定使用plotly.js,其他的比如function-plot 看起来也不错,以后有时间再看。
Plotly
plotly.js is the open source JavaScript graphing library that powers Plotly.
Plotly 可以称之为迄今最优秀的绘图库,没有之一。
简单案例
代码
<!DOCTYPE html>
<html>
<head>
<meta charset="UTF-8">
<title>plot 绘制图像</title>
</head>
<body>
<p id="tester" style="width:600px;height:250px;"></p>
</body>
<script src="https://cdn.plot.ly/plotly-1.2.0.min.js"></script>
<!-- test -->
<script>
TESTER = document.getElementById('tester');
Plotly.plot(TESTER, [{
x: [1, 2, 3, 4, 5],
y: [1, 2, 4, 8, 16]
}], {
margin: {t: 0}
});
</script>
</html>效果

点图
绘制数学图像
数学图像绘图的原理。比如说 y = 2*x+1,实际上就是一系列 (x,y) 的点连接而成的图像。
代码
<p id="math-function" style="width:600px;height:250px;"></p>
<script src="https://cdn.plot.ly/plotly-1.2.0.min.js"></script>
<script>
TESTER = document.getElementById('math-function');
var x = [], y = [];
for(var i = -10; i < 10; i += 1) {
x.push(i);
y.push(2*i+1);
}
Plotly.plot(TESTER, [{
x: x,
y: y
}], {
margin: {t: 0}
});
</script>效果
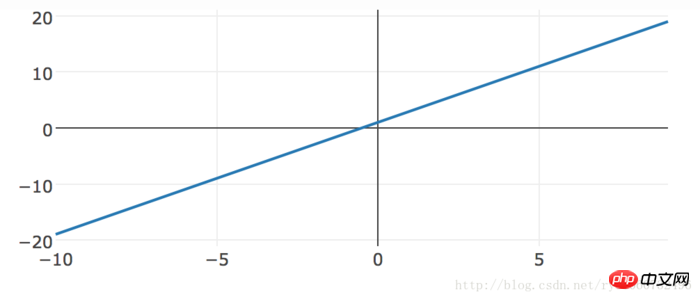
函数图像
上面是我整理给大家的,希望今后会对大家有帮助。
相关文章:
通过webpack项目如何实现调试以及独立打包配置文件(详细教程)
Atas ialah kandungan terperinci 详细解读plotly.js 绘图库使用教程(详细教程). Untuk maklumat lanjut, sila ikut artikel berkaitan lain di laman web China PHP!

Alat AI Hot

Undresser.AI Undress
Apl berkuasa AI untuk mencipta foto bogel yang realistik

AI Clothes Remover
Alat AI dalam talian untuk mengeluarkan pakaian daripada foto.

Undress AI Tool
Gambar buka pakaian secara percuma

Clothoff.io
Penyingkiran pakaian AI

AI Hentai Generator
Menjana ai hentai secara percuma.

Artikel Panas
Alat panas

Notepad++7.3.1
Editor kod yang mudah digunakan dan percuma

SublimeText3 versi Cina
Versi Cina, sangat mudah digunakan

Hantar Studio 13.0.1
Persekitaran pembangunan bersepadu PHP yang berkuasa

Dreamweaver CS6
Alat pembangunan web visual

SublimeText3 versi Mac
Perisian penyuntingan kod peringkat Tuhan (SublimeText3)
Topik panas
 1376
1376
 52
52

 Bagaimana untuk melaksanakan sistem pengecaman pertuturan dalam talian menggunakan WebSocket dan JavaScript
Dec 17, 2023 pm 02:54 PM
Bagaimana untuk melaksanakan sistem pengecaman pertuturan dalam talian menggunakan WebSocket dan JavaScript
Dec 17, 2023 pm 02:54 PM
Cara menggunakan WebSocket dan JavaScript untuk melaksanakan sistem pengecaman pertuturan dalam talian Pengenalan: Dengan perkembangan teknologi yang berterusan, teknologi pengecaman pertuturan telah menjadi bahagian penting dalam bidang kecerdasan buatan. Sistem pengecaman pertuturan dalam talian berdasarkan WebSocket dan JavaScript mempunyai ciri kependaman rendah, masa nyata dan platform merentas, dan telah menjadi penyelesaian yang digunakan secara meluas. Artikel ini akan memperkenalkan cara menggunakan WebSocket dan JavaScript untuk melaksanakan sistem pengecaman pertuturan dalam talian.
 Bagaimana untuk memaparkan akhiran fail di bawah sistem Win11? Tafsiran terperinci
Mar 09, 2024 am 08:24 AM
Bagaimana untuk memaparkan akhiran fail di bawah sistem Win11? Tafsiran terperinci
Mar 09, 2024 am 08:24 AM
Bagaimana untuk memaparkan akhiran fail di bawah sistem Win11? Penjelasan terperinci: Dalam sistem pengendalian Windows 11, akhiran fail merujuk kepada titik selepas nama fail dan aksara selepasnya, yang digunakan untuk menunjukkan jenis fail. Secara lalai, sistem Windows 11 menyembunyikan akhiran fail, supaya anda hanya boleh melihat nama fail dalam penjelajah fail tetapi tidak dapat memahami jenis fail secara intuitif. Walau bagaimanapun, bagi sesetengah pengguna, memaparkan akhiran fail adalah perlu kerana ia membantu mereka mengenal pasti jenis fail dengan lebih baik dan melaksanakan operasi yang berkaitan.
 WebSocket dan JavaScript: teknologi utama untuk melaksanakan sistem pemantauan masa nyata
Dec 17, 2023 pm 05:30 PM
WebSocket dan JavaScript: teknologi utama untuk melaksanakan sistem pemantauan masa nyata
Dec 17, 2023 pm 05:30 PM
WebSocket dan JavaScript: Teknologi utama untuk merealisasikan sistem pemantauan masa nyata Pengenalan: Dengan perkembangan pesat teknologi Internet, sistem pemantauan masa nyata telah digunakan secara meluas dalam pelbagai bidang. Salah satu teknologi utama untuk mencapai pemantauan masa nyata ialah gabungan WebSocket dan JavaScript. Artikel ini akan memperkenalkan aplikasi WebSocket dan JavaScript dalam sistem pemantauan masa nyata, memberikan contoh kod dan menerangkan prinsip pelaksanaannya secara terperinci. 1. Teknologi WebSocket
 Bagaimana untuk melaksanakan sistem tempahan dalam talian menggunakan WebSocket dan JavaScript
Dec 17, 2023 am 09:39 AM
Bagaimana untuk melaksanakan sistem tempahan dalam talian menggunakan WebSocket dan JavaScript
Dec 17, 2023 am 09:39 AM
Cara menggunakan WebSocket dan JavaScript untuk melaksanakan sistem tempahan dalam talian Dalam era digital hari ini, semakin banyak perniagaan dan perkhidmatan perlu menyediakan fungsi tempahan dalam talian. Adalah penting untuk melaksanakan sistem tempahan dalam talian yang cekap dan masa nyata. Artikel ini akan memperkenalkan cara menggunakan WebSocket dan JavaScript untuk melaksanakan sistem tempahan dalam talian dan memberikan contoh kod khusus. 1. Apakah itu WebSocket? WebSocket ialah kaedah dupleks penuh pada sambungan TCP tunggal.
 Cara menggunakan JavaScript dan WebSocket untuk melaksanakan sistem pesanan dalam talian masa nyata
Dec 17, 2023 pm 12:09 PM
Cara menggunakan JavaScript dan WebSocket untuk melaksanakan sistem pesanan dalam talian masa nyata
Dec 17, 2023 pm 12:09 PM
Pengenalan kepada cara menggunakan JavaScript dan WebSocket untuk melaksanakan sistem pesanan dalam talian masa nyata: Dengan populariti Internet dan kemajuan teknologi, semakin banyak restoran telah mula menyediakan perkhidmatan pesanan dalam talian. Untuk melaksanakan sistem pesanan dalam talian masa nyata, kami boleh menggunakan teknologi JavaScript dan WebSocket. WebSocket ialah protokol komunikasi dupleks penuh berdasarkan protokol TCP, yang boleh merealisasikan komunikasi dua hala masa nyata antara pelanggan dan pelayan. Dalam sistem pesanan dalam talian masa nyata, apabila pengguna memilih hidangan dan membuat pesanan
 Dalam folder manakah data kuki pada komputer anda berada? Tafsiran terperinci
Jan 19, 2024 am 10:19 AM
Dalam folder manakah data kuki pada komputer anda berada? Tafsiran terperinci
Jan 19, 2024 am 10:19 AM
Dengan perkembangan Internet yang berterusan, orang ramai semakin tidak dapat dipisahkan daripada pelayar. Dalam pelayar, semua orang akan menggunakan kuki lebih atau kurang. Walau bagaimanapun, ramai orang tidak tahu folder mana data kuki itu berada. Mari jelaskan secara terperinci hari ini. Pertama, kita perlu memahami apa itu kuki. Ringkasnya, kuki ialah sekeping maklumat teks yang disimpan oleh penyemak imbas, yang digunakan untuk menyimpan beberapa tetapan peribadi pengguna dalam penyemak imbas atau merekodkan operasi sejarah pengguna, dsb. Apabila pengguna membuka laman web yang sama sekali lagi, c
 JavaScript dan WebSocket: Membina sistem ramalan cuaca masa nyata yang cekap
Dec 17, 2023 pm 05:13 PM
JavaScript dan WebSocket: Membina sistem ramalan cuaca masa nyata yang cekap
Dec 17, 2023 pm 05:13 PM
JavaScript dan WebSocket: Membina sistem ramalan cuaca masa nyata yang cekap Pengenalan: Hari ini, ketepatan ramalan cuaca sangat penting kepada kehidupan harian dan membuat keputusan. Apabila teknologi berkembang, kami boleh menyediakan ramalan cuaca yang lebih tepat dan boleh dipercayai dengan mendapatkan data cuaca dalam masa nyata. Dalam artikel ini, kita akan mempelajari cara menggunakan teknologi JavaScript dan WebSocket untuk membina sistem ramalan cuaca masa nyata yang cekap. Artikel ini akan menunjukkan proses pelaksanaan melalui contoh kod tertentu. Kami
 Tutorial JavaScript Mudah: Cara Mendapatkan Kod Status HTTP
Jan 05, 2024 pm 06:08 PM
Tutorial JavaScript Mudah: Cara Mendapatkan Kod Status HTTP
Jan 05, 2024 pm 06:08 PM
Tutorial JavaScript: Bagaimana untuk mendapatkan kod status HTTP, contoh kod khusus diperlukan: Dalam pembangunan web, interaksi data dengan pelayan sering terlibat. Apabila berkomunikasi dengan pelayan, kami selalunya perlu mendapatkan kod status HTTP yang dikembalikan untuk menentukan sama ada operasi itu berjaya dan melaksanakan pemprosesan yang sepadan berdasarkan kod status yang berbeza. Artikel ini akan mengajar anda cara menggunakan JavaScript untuk mendapatkan kod status HTTP dan menyediakan beberapa contoh kod praktikal. Menggunakan XMLHttpRequest
