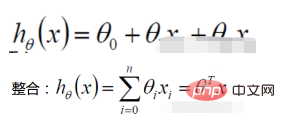

Definisi fungsi kemungkinan: nilai sampel bersama X Fungsi berikut


fungsi kemungkinan : Apakah jenis parameter sebenarnya nilai sebenar apabila digabungkan dengan data kami?
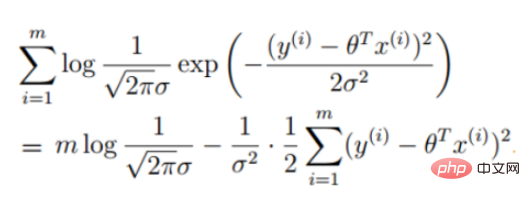
2. Fungsi kemungkinan regresi linear


Diubah menjadi tugas penurunan kecerunan, fungsi objektif regresi logistik 
def sigmoid(z):
   return 1 / (1 + np.exp(-z))
def model(X, theta):
    return sigmoid(np.dot(X, theta.T))
def cost(X, y, theta):
     left = np.multiply(-y, np.log(model(X, theta)))
     right = np.multiply(1 - y, np.log(1 - model(X, theta)))
return np.sum(left - right) / (len(X))def gradient(X, y, theta):
grad = np.zeros(theta.shape)
error = (model(X, theta)- y).ravel()
for j in range(len(theta.ravel())): #for each parmeter
term = np.multiply(error, X[:,j])
grad[0, j] = np.sum(term) / len(X)
return gradKecerunan

STOP_ITER = 0
STOP_COST = 1
STOP_GRAD = 2

def stopCriterion(type, value, threshold):
    # 设定三种不同的停止策略
    if type == STOP_ITER:  # 设定迭代次数
        return value > threshold
    elif type == STOP_COST:  # 根据损失值停止
        return abs(value[-1] - value[-2]) < threshold
    elif type == STOP_GRAD:  # 根据梯度变化停止
return np.linalg.norm(value) < thresholdStrategi berhenti keturunan kecerunan
import numpy.random
#洗牌
def shuffleData(data):
    np.random.shuffle(data)
    cols = data.shape[1]
    X = data[:, 0:cols-1]
    y = data[:, cols-1:]
return X, ySampel rombakan
def descent(data, theta, batchSize, stopType, thresh, alpha):
    # 梯度下降求解

    init_time = time.time()
    i = 0  # 迭代次数
    k = 0  # batch
    X, y = shuffleData(data)
    grad = np.zeros(theta.shape)  # 计算的梯度
    costs = [cost(X, y, theta)]  # 损失值

    while True:
        grad = gradient(X[k:k + batchSize], y[k:k + batchSize], theta)
        k += batchSize  # 取batch数量个数据
        if k >= n:
            k = 0
            X, y = shuffleData(data)  # 重新洗牌
        theta = theta - alpha * grad  # 参数更新
        costs.append(cost(X, y, theta))  # 计算新的损失
        i += 1

        if stopType == STOP_ITER:
            value = i
        elif stopType == STOP_COST:
            value = costs
        elif stopType == STOP_GRAD:
            value = grad
        if stopCriterion(stopType, value, thresh): break

return theta, i - 1, costs, grad, time.time() - init_timePenyelesaian keturunan kecerunan
import numpy as np
import pandas as pd
import matplotlib.pyplot as plt
import os
import numpy.random
import time


def sigmoid(z):
    return 1 / (1 + np.exp(-z))


def model(X, theta):
    return sigmoid(np.dot(X, theta.T))


def cost(X, y, theta):
    left = np.multiply(-y, np.log(model(X, theta)))
    right = np.multiply(1 - y, np.log(1 - model(X, theta)))
    return np.sum(left - right) / (len(X))


def gradient(X, y, theta):
    grad = np.zeros(theta.shape)
    error = (model(X, theta) - y).ravel()
    for j in range(len(theta.ravel())):  # for each parmeter
        term = np.multiply(error, X[:, j])
        grad[0, j] = np.sum(term) / len(X)
    return grad


STOP_ITER = 0
STOP_COST = 1
STOP_GRAD = 2


def stopCriterion(type, value, threshold):
    # 设定三种不同的停止策略
    if type == STOP_ITER:  # 设定迭代次数
        return value > threshold
    elif type == STOP_COST:  # 根据损失值停止
        return abs(value[-1] - value[-2]) < threshold
    elif type == STOP_GRAD:  # 根据梯度变化停止
        return np.linalg.norm(value) < threshold


# 洗牌
def shuffleData(data):
    np.random.shuffle(data)
    cols = data.shape[1]
    X = data[:, 0:cols - 1]
    y = data[:, cols - 1:]
    return X, y


def descent(data, theta, batchSize, stopType, thresh, alpha):
    # 梯度下降求解

    init_time = time.time()
    i = 0  # 迭代次数
    k = 0  # batch
    X, y = shuffleData(data)
    grad = np.zeros(theta.shape)  # 计算的梯度
    costs = [cost(X, y, theta)]  # 损失值

    while True:
        grad = gradient(X[k:k + batchSize], y[k:k + batchSize], theta)
        k += batchSize  # 取batch数量个数据
        if k >= n:
            k = 0
            X, y = shuffleData(data)  # 重新洗牌
        theta = theta - alpha * grad  # 参数更新
        costs.append(cost(X, y, theta))  # 计算新的损失
        i += 1

        if stopType == STOP_ITER:
            value = i
        elif stopType == STOP_COST:
            value = costs
        elif stopType == STOP_GRAD:
            value = grad
        if stopCriterion(stopType, value, thresh): break

    return theta, i - 1, costs, grad, time.time() - init_time


def runExpe(data, theta, batchSize, stopType, thresh, alpha):
    # import pdb
    # pdb.set_trace()
    theta, iter, costs, grad, dur = descent(data, theta, batchSize, stopType, thresh, alpha)
    name = "Original" if (data[:, 1] > 2).sum() > 1 else "Scaled"
    name += " data - learning rate: {} - ".format(alpha)
    if batchSize == n:
        strDescType = "Gradient"  # 批量梯度下降
    elif batchSize == 1:
        strDescType = "Stochastic"  # 随机梯度下降
    else:
        strDescType = "Mini-batch ({})".format(batchSize)  # 小批量梯度下降
    name += strDescType + " descent - Stop: "
    if stopType == STOP_ITER:
        strStop = "{} iterations".format(thresh)
    elif stopType == STOP_COST:
        strStop = "costs change < {}".format(thresh)
    else:
        strStop = "gradient norm < {}".format(thresh)
    name += strStop
    print("***{}\nTheta: {} - Iter: {} - Last cost: {:03.2f} - Duration: {:03.2f}s".format(
        name, theta, iter, costs[-1], dur))
    fig, ax = plt.subplots(figsize=(12, 4))
    ax.plot(np.arange(len(costs)), costs, 'r')
    ax.set_xlabel('Iterations')
    ax.set_ylabel('Cost')
    ax.set_title(name.upper() + ' - Error vs. Iteration')
    return theta


path = 'data' + os.sep + 'LogiReg_data.txt'
pdData = pd.read_csv(path, header=None, names=['Exam 1', 'Exam 2', 'Admitted'])
positive = pdData[pdData['Admitted'] == 1]
negative = pdData[pdData['Admitted'] == 0]

# 画图观察样本情况
fig, ax = plt.subplots(figsize=(10, 5))
ax.scatter(positive['Exam 1'], positive['Exam 2'], s=30, c='b', marker='o', label='Admitted')
ax.scatter(negative['Exam 1'], negative['Exam 2'], s=30, c='r', marker='x', label='Not Admitted')
ax.legend()
ax.set_xlabel('Exam 1 Score')
ax.set_ylabel('Exam 2 Score')

pdData.insert(0, 'Ones', 1)

# 划分训练数据与标签
orig_data = pdData.values
cols = orig_data.shape[1]
X = orig_data[:, 0:cols - 1]
y = orig_data[:, cols - 1:cols]
# 设置初始参数0
theta = np.zeros([1, 3])

# 选择的梯度下降方法是基于所有样本的
n = 100
runExpe(orig_data, theta, n, STOP_ITER, thresh=5000, alpha=0.000001)
runExpe(orig_data, theta, n, STOP_COST, thresh=0.000001, alpha=0.001)
runExpe(orig_data, theta, n, STOP_GRAD, thresh=0.05, alpha=0.001)
runExpe(orig_data, theta, 1, STOP_ITER, thresh=5000, alpha=0.001)
runExpe(orig_data, theta, 1, STOP_ITER, thresh=15000, alpha=0.000002)
runExpe(orig_data, theta, 16, STOP_ITER, thresh=15000, alpha=0.001)

from sklearn import preprocessing as pp

# 数据预处理
scaled_data = orig_data.copy()
scaled_data[:, 1:3] = pp.scale(orig_data[:, 1:3])

runExpe(scaled_data, theta, n, STOP_ITER, thresh=5000, alpha=0.001)
runExpe(scaled_data, theta, n, STOP_GRAD, thresh=0.02, alpha=0.001)
theta = runExpe(scaled_data, theta, 1, STOP_GRAD, thresh=0.002 / 5, alpha=0.001)
runExpe(scaled_data, theta, 16, STOP_GRAD, thresh=0.002 * 2, alpha=0.001)


# 设定阈值
def predict(X, theta):
    return [1 if x >= 0.5 else 0 for x in model(X, theta)]


# 计算精度
scaled_X = scaled_data[:, :3]
y = scaled_data[:, 3]
predictions = predict(scaled_X, theta)
correct = [1 if ((a == 1 and b == 1) or (a == 0 and b == 0)) else 0 for (a, b) in zip(predictions, y)]
accuracy = (sum(map(int, correct)) % len(correct))
print('accuracy = {0}%'.format(accuracy))Sukar untuk menangani masalah ketidakseimbangan data. Sebagai contoh: Jika kita menghadapi masalah di mana sampel positif dan negatif adalah sangat tidak seimbang, seperti nisbah sampel positif dan negatif ialah 10000:1 Jika kita meramalkan semua sampel sebagai positif, kita juga boleh membuat nilai fungsi kehilangan lebih kecil. Tetapi sebagai pengelas, keupayaannya untuk membezakan sampel positif dan negatif tidak akan menjadi sangat baik.
Memproses data tak linear lebih menyusahkan. Regresi logistik, tanpa memperkenalkan kaedah lain, hanya boleh mengendalikan data boleh dipisahkan secara linear, atau selanjutnya, mengendalikan masalah klasifikasi binari.
Regression logistik itu sendiri tidak boleh menapis ciri. Kadangkala, kami menggunakan gbdt untuk menapis ciri dan kemudian menggunakan regresi logistik.
Atas ialah kandungan terperinci Bagaimana untuk melaksanakan keturunan kecerunan untuk menyelesaikan regresi logistik dalam python. Untuk maklumat lanjut, sila ikut artikel berkaitan lain di laman web China PHP!


