
Isu ini menggunakan perpustakaan visualisasi Python's Pyecharts untuk menarik data cuaca sejarah
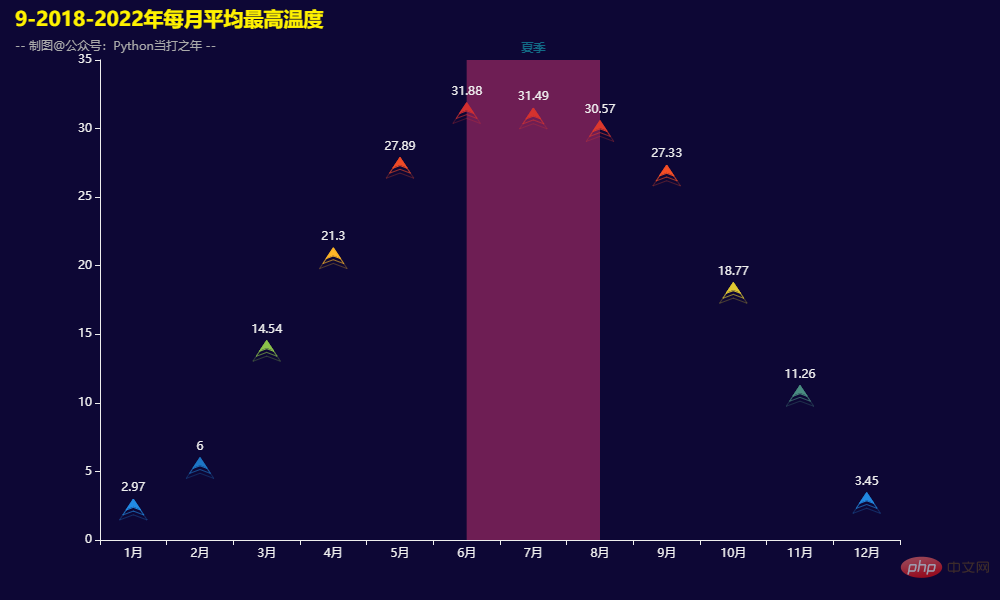
Panda — Pemprosesan data Pyecarts — Visualisasi data pemprosesan data P andas 2.3 处理日期数据 3.5 2022年夜间_白天风力分布 3.7 2022年白天风向分布 3.8 2018-2022年各类型天气数量 3.9 2018-2022年每月平均最高温度df_weather_1 = df_weather.copy()
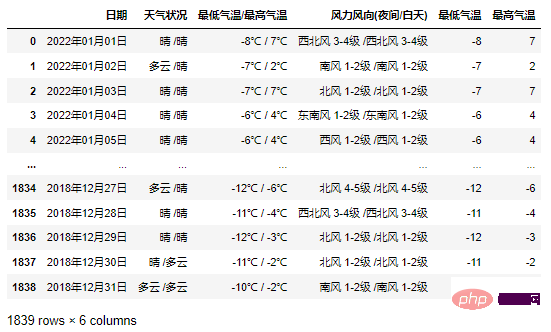
df_weather_1[['最低气温','最高气温']] = df_weather_1['最低气温/最高气温'].str.split(' / ',expand=True)
df_weather_1['最低气温'] = df_weather_1['最低气温'].str[:-2]
df_weather_1['最高气温'] = df_weather_1['最高气温'].str[:-1]
df_weather_1['最低气温'] = df_weather_1['最低气温'].astype('int')
df_weather_1['最高气温'] = df_weather_1['最高气温'].astype('int')
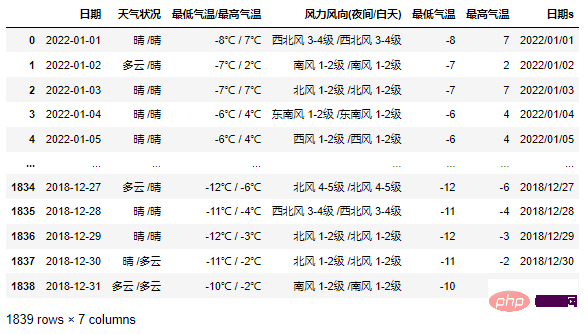
df_weather_1['日期'] = pd.to_datetime(df_weather_1['日期'],format='%Y年%m月%d日')
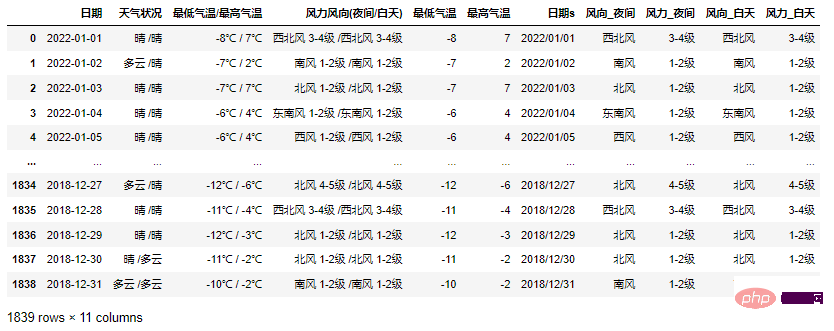
df_weather_1['日期s'] = df_weather_1['日期'].dt.strftime('%Y/%m/%d')
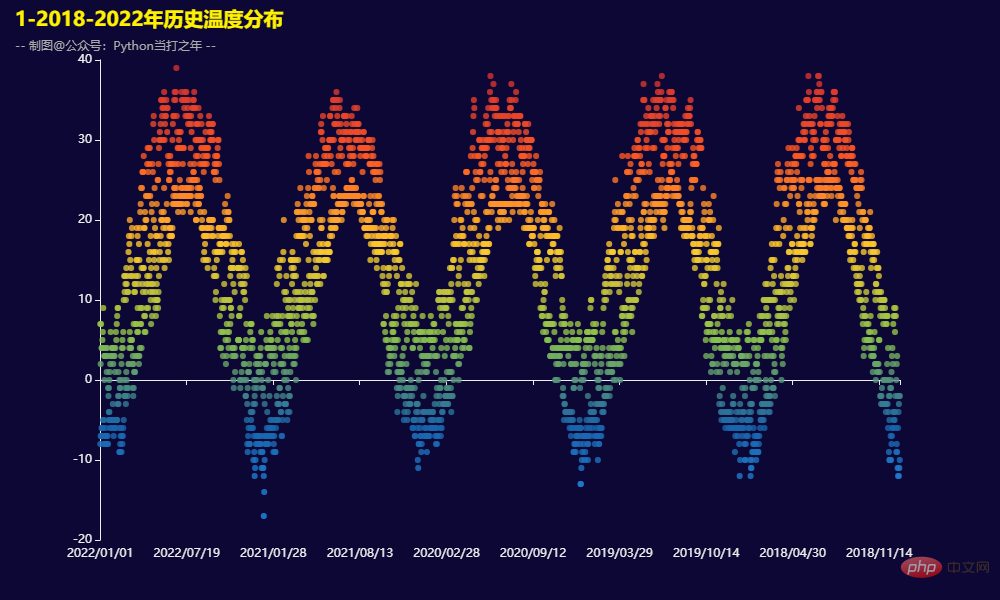
def get_scatter():
    scatter = (
        Scatter()
        .add_xaxis(x_data)
        .add_yaxis("最低气温", y_data1)
        .add_yaxis("最高气温", y_data2)
        .set_global_opts(
            legend_opts=opts.LegendOpts(is_show=False),
            visualmap_opts=opts.VisualMapOpts(
                is_show=False,
                range_color=range_color
            ),
            title_opts=opts.TitleOpts(
                title='1-2018-2022年历史温度分布',
                subtitle='-- 制图@公众号:Python当打之年 --',
                pos_top='1%',
                pos_left="1%",
            )
        )
    )
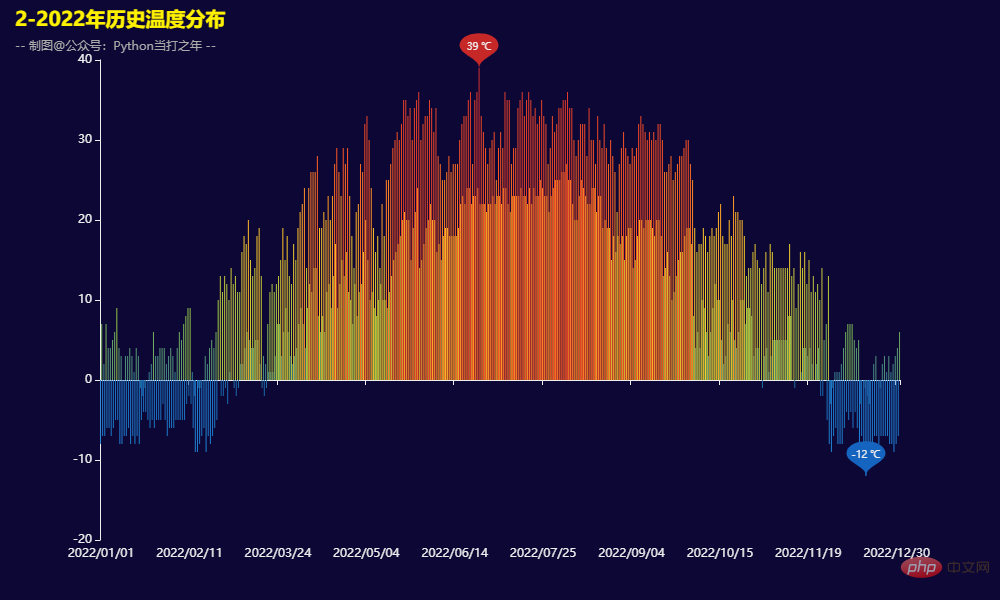
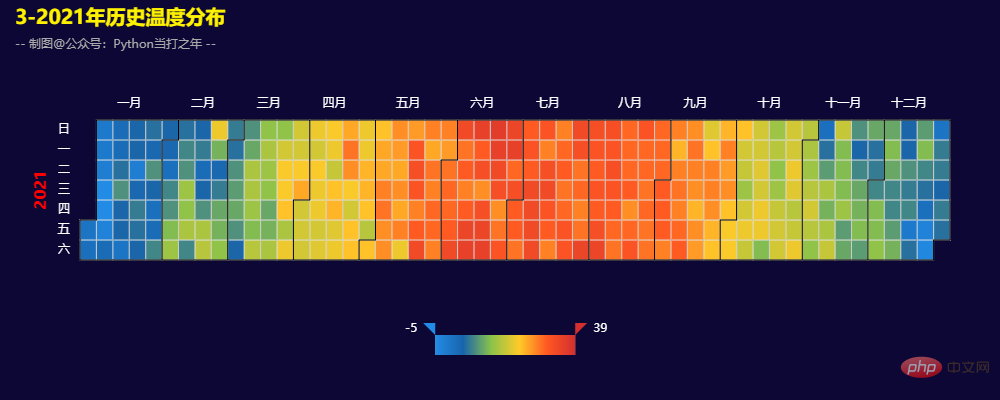
def get_calendar():
    calendar = (
        Calendar()
        .add('',
             data_21,
             calendar_opts=opts.CalendarOpts(
                 pos_right='5%',
                 range_='2021',
                daylabel_opts=opts.CalendarDayLabelOpts(name_map='cn'),
                monthlabel_opts=opts.CalendarMonthLabelOpts(name_map='cn')
             ),
        )
        .set_global_opts(
            title_opts=opts.TitleOpts(
                title='3-2021年历史温度分布',
                subtitle='-- 制图@公众号:Python当打之年 --',
                pos_top='1%',
                pos_left="1%",
            ),
            visualmap_opts=opts.VisualMapOpts(
                range_color=range_color,
            )
        )
    )
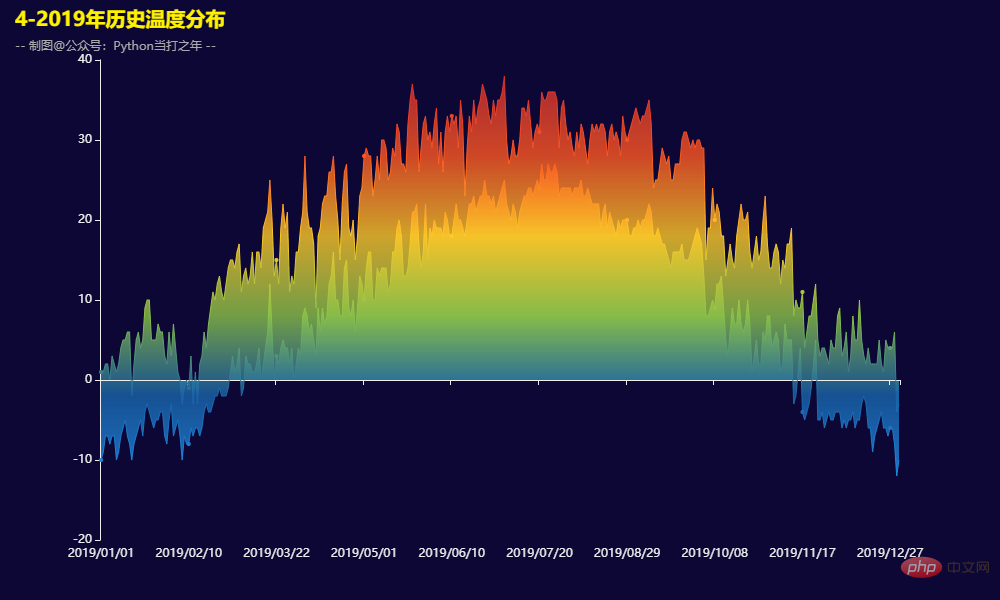
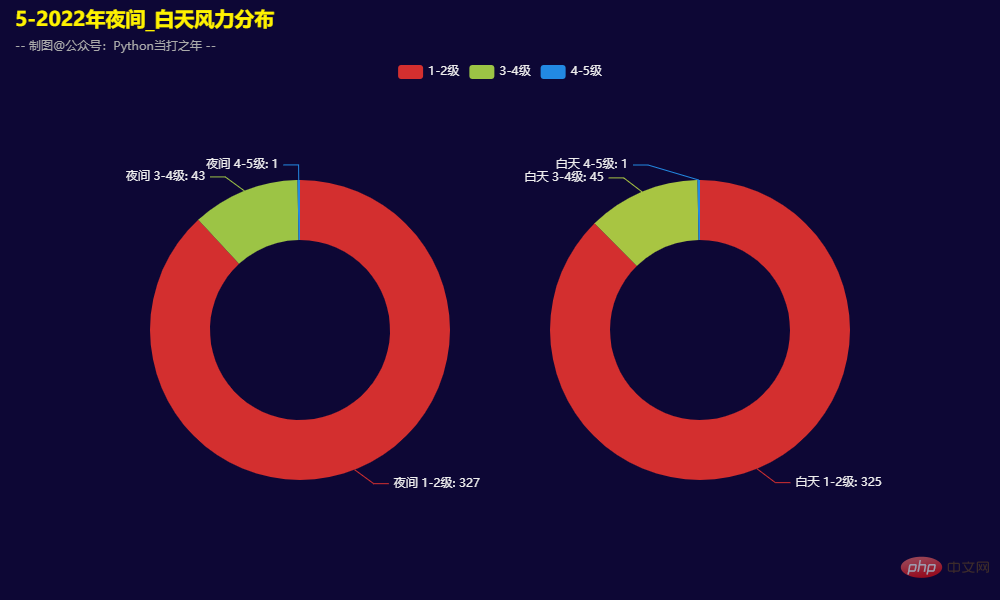
def get_pie():
    pie = (
        Pie()
        .add(
            "",
            [list(z) for z in zip(x_data, y_data1)],
            radius=["30%", "50%"],
            center=["30%", "55%"],
        )
        .add(
            "",
            [list(z) for z in zip(x_data, y_data2)],
            radius=["30%", "50%"],
            center=["70%", "55%"],
        )
        .set_global_opts(
            title_opts=opts.TitleOpts(
                title='5-2022年夜间_白天风力分布',
                subtitle='-- 制图@公众号:Python当打之年 --',
                pos_top='1%',
                pos_left="1%",
            ),
            legend_opts=opts.LegendOpts(pos_top='10%'),
            visualmap_opts=opts.VisualMapOpts(
                is_show=False,
                range_color=range_color
            ),
        )
    )
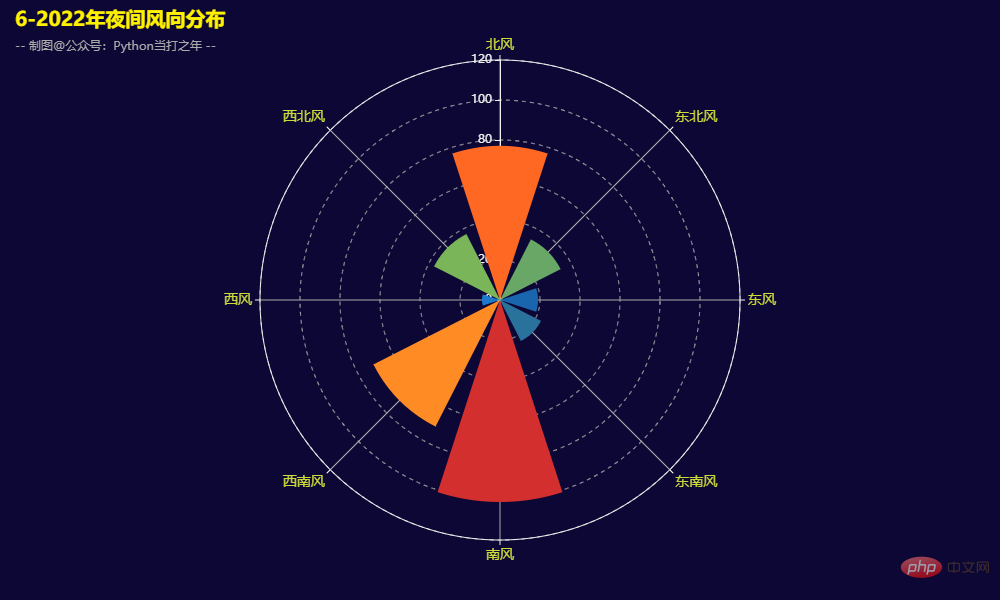
def get_polor():
    polor = (
        Polar()
        .add("", values,type_="bar")
        .set_global_opts(
            legend_opts=opts.LegendOpts(is_show=False),
            visualmap_opts=opts.VisualMapOpts(
                is_show=False,
                range_color=range_color
            ),
            title_opts=opts.TitleOpts(
                title='6-2022年夜间风向分布',
                subtitle='-- 制图@公众号:Python当打之年 --',
                pos_top='1%',
                pos_left="1%",
            ),
        )
    )
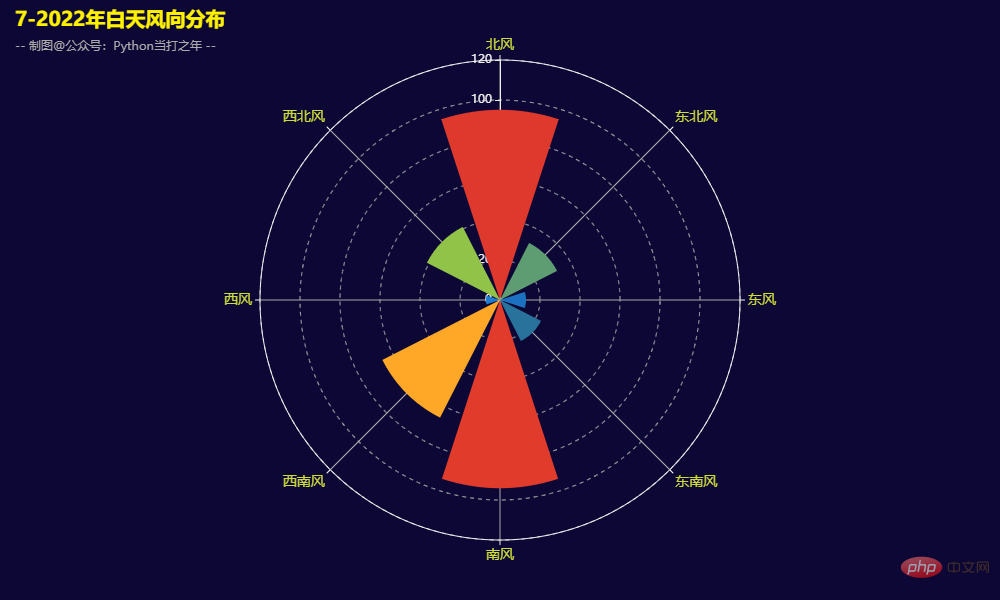
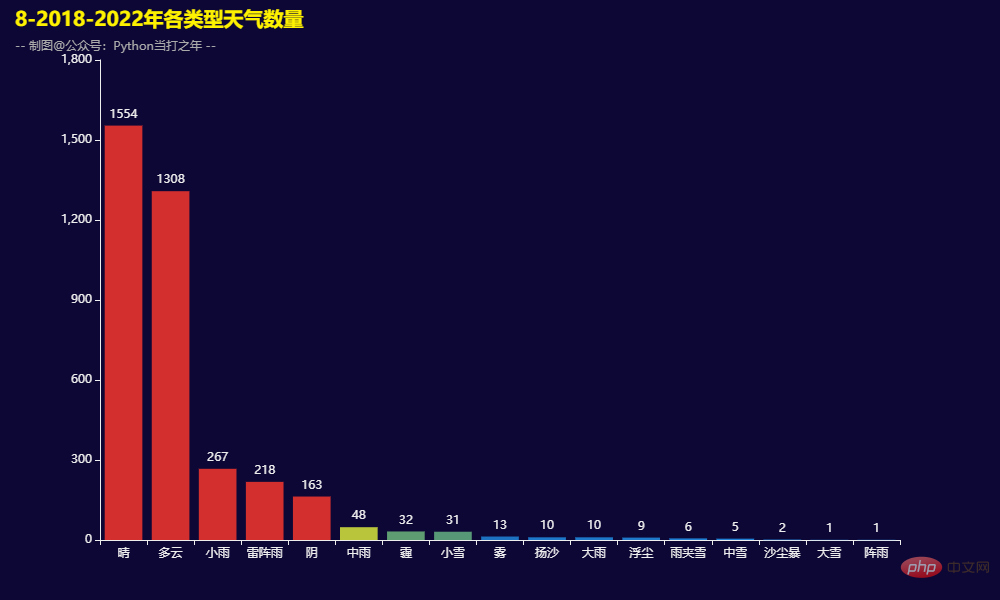
def get_bar():
    bar = (
        Bar()
        .add_xaxis(x_data)
        .add_yaxis("",y_data)
        .set_global_opts(
            visualmap_opts=opts.VisualMapOpts(
                is_show=False,
                range_color=range_color
            ),
            legend_opts=opts.LegendOpts(is_show=False),
            title_opts=opts.TitleOpts(
                title='8-2018-2022年各类型天气数量',
                subtitle='-- 制图@公众号:Python当打之年 --',
                pos_top='1%',
                pos_left="1%",
            ),
        )
    )
Atas ialah kandungan terperinci Pandas+Pyecharts |. Visualisasi data cuaca bersejarah di Beijing dalam tempoh lima tahun yang lalu. Untuk maklumat lanjut, sila ikut artikel berkaitan lain di laman web China PHP!
 Bagaimana untuk membuka kunci sekatan kebenaran android
 Perbezaan antara topeng tampal dan topeng pateri
 Bagaimanakah sari kata PR muncul perkataan demi perkataan?
 Ciri-ciri aritmetik pelengkap dua
 Bagaimana untuk menetapkan ketelusan dalam CSS
 penggunaan format_nombor
 Apakah maksud rangkaian gprs?
 susun atur mutlak


