Method: 1. If slow query is not enabled, use "set global slow_query_log='ON';" to enable slow query; 2. Use "set global slow_query_log_file=path" to set the slow query file storage location; 3. Use Just "subl path" to query the file.

The operating environment of this tutorial: centos 7 system, mysql8.0.22 version, Dell G3 computer.
Record search for slow sql statements in Mysql
Slow query log slow_query_log is used to record slow sql statements. , by querying the log to find which SQL statement is slower, so that the slower SQL can be optimized.
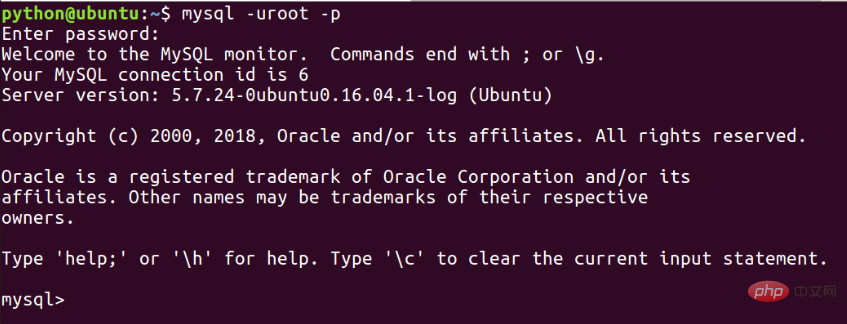
Log in to the mysql database:

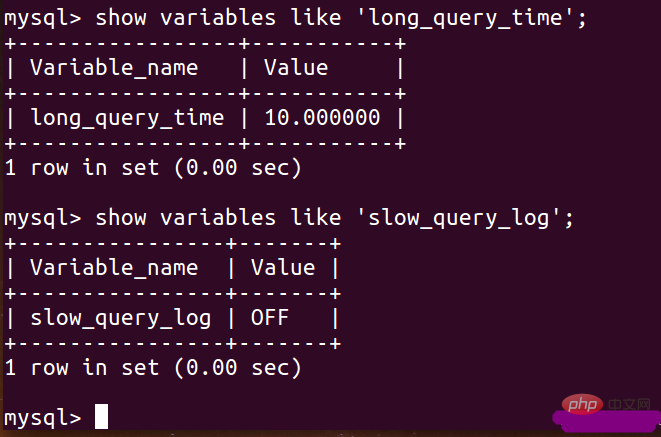
1. Check whether the current slow query is enabled. If not, enable it
And the time specified by slow query:
show variables like 'slow_query_log';
show variableslike 'long_query_time';

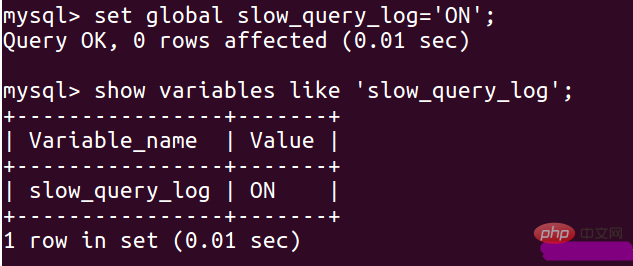
If the result of your query is OFF, you need to change it to ON through relevant settings :
set global slow_query_log='ON';

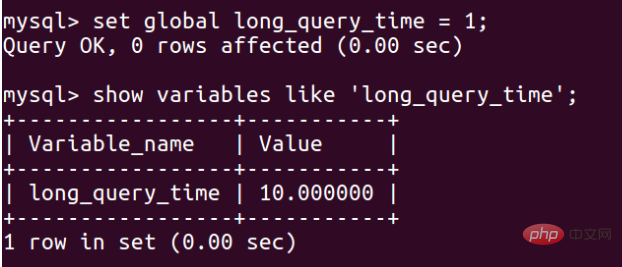
Set the slow query tracking time to 1s:

Here you set it, this world It will not become 1s immediately. It will take effect after the database is restarted:

2. Set the location where the slow query log file is saved:
set global slow_query_log_file='/var/lib/mysql/test_1116.log';
3. View the following configured files:
sudo subl /var/lib/mysql/test_1116.log

Extended knowledge:
MySQL database slow query problem troubleshooting method
I recently encountered the problem of slow database response several times. I sorted out the processing process and analysis ideas, and executed the script. Hope this helps others.
MySQL slow query performance
It is obvious that most application functions are slowed down, but it is not completely inoperable. There is still a response after waiting for a long time. But the whole system looks very stuck.
Query the number of slow queries
Generally speaking, for a normally operating MySQL server, it is normal for the slow queries per minute to be in the single digits. It is not unacceptable to occasionally surge to double digits. The system may have problems when it is close to 100, but it can still be used. The number of slow queries that have gone wrong these few times has reached more than 1,000.
The number of slow queries is stored in the slow_log table in the mysql library.
SELECT * FROM `slow_log` where start_time > '2019/05/19 00:00:00';
In this way, you can find out the slow queries for a day.
View the current query status
Everyone should commonly use show processlist to view the queries currently being executed in the system. In fact, these data are also stored in the processlist table in the information_schema library, so if To do conditional query, it is more convenient to query this table directly.
For example, view all current processes
select * from information_schema.processlist
View the currently ongoing queries and sort them in reverse order according to the execution time
select * from information_schema.processlist where info is not null order by time desc
Normal running database, because of the execution speed of a query Soon, the number of queries where the info caught by our select is not null will be very small. A library with a heavy load like ours can usually only find a few items. If dozens of queries with non-empty info can be found at one time, it can also be considered that there is a problem with the system.
System Problems and Positioning
When we noticed that the system was slowing down, we immediately checked using slow queries and checking the processlist. We found that the number of slow queries per minute soared to more than 1,000. At the same time, a large number of queries are being executed.
Because the top priority is to restore the normal operation of the system as soon as possible, the most direct way to affect it is to check how many of the queries in the process list are in the lock state, or have been executed for a long time, and delete these processes Use the kill command to kill it. By continuously killing these processes that may cause system congestion, the system can eventually be temporarily restored to normal state. Of course, this is only a stop-gap measure.
In addition, the most important thing is of course to analyze which queries cause system blocking. We still use slow queries for analysis.
There are several important indicators in the slow query table query results:
start_time start time. This parameter should be used to match the time of the system problem to locate which query is the culprit.
query_time query time
rows_sent and rows_examined The number of results sent and the number of rows scanned by the query. These two values are particularly important, especially rows_examined. Basically it tells us which query is the "big" query to pay attention to.
In actual operation, we also analyze the queries with a large number of rows_examined one by one, add indexes, and modify the writing of query statements to completely solve the problem.
Processing results and reflection
After checking and rectifying all slow queries, the current number of MySQL slow queries per minute hovers between 1 and 2, and the CPU load is also very low. The problem is basically solved.
Reflecting on the reasons for the problem, there are several points that need to be noted:
1. Database problems often do not cause problems immediately after they go online, but there is a cumulative process, and the problems continue to accumulate. The query statements will gradually increase the system load, and the last straw that breaks the camel's back often seems inexplicable
2. The last straw may not even exist at all. It is not a release or a function online. Instead, as user usage increases and the amount of data accumulates, it explodes
3. Since the emergence of problems is a cumulative process, it is necessary to conduct a review before each code release
4. The addition of indexes is very important
5. The monitoring of slow queries also needs to be included in the monitoring scope of Zabbix
Recommended learning: mysql video tutorial
The above is the detailed content of How to query slow sql statement in mysql. For more information, please follow other related articles on the PHP Chinese website!