

Everyone knows that code debugging is very important during the development process. Debugging skills for some common errors can help improve the efficiency of code writing.
This article describes various ways to debug PHP applications, including turning on error reporting in Apache and PHP, and finding the source of more difficult bugs by strategically placing print statements in a simple PHP script. . You'll also learn about the PHPEclipse plug-in for Eclipse, a flexible development environment with real-time syntax parsing capabilities, and the DBG debugger extension for PHPEclipse.
Introduction
There are many PHP debugging techniques that can save a lot of time when coding. An effective yet basic debugging technique is to turn on error reporting. Another, slightly more advanced technique involves using print statements, which can help pinpoint harder-to-find bugs by displaying what actually appears on the screen. PHPEclipse is an Eclipse plug-in that highlights common syntax errors and can be used in conjunction with the debugger to set breakpoints.
Setup
To learn the concepts described in this article, PHP, a web server, and Eclipse are required. The debugger extension supports PHP version V5.0.3.
We need a web server to parse pages created with PHP and display them to the browser. Apache2 is used in this article. However, any web server will suffice.
To take advantage of some of the debugging techniques introduced in this article, you need to install Eclipse V3.1.1 and the plug-in PHPEclipse V1.1.8. Since Eclipse requires Java™ technology, download it as well.
Also requires PHP debugger extension module. Installing it is a little tricky. Please follow the instructions for installing the debugger extension carefully. Now, comment out the lines in the php.ini file that require the PHP extension to be loaded and configured. Uncomment it when you need to use the debugger.
Please see Resources for download information. Now about the error messages.
Error message
Error message is the first line of defense as a developer. No one wants to develop code in PHP on a server that is not configured to display error messages. However, please remember that when you have debugged your code and are ready to run it, you should make sure that error reporting is turned off as you do not want your site visitors to see error messages as this will give them enough information to exploit the site's weaknesses and Hack the site.
You can also use error messages to your advantage, since they show the correct line of code that threw or generated the error. This way, debugging becomes a matter of looking in the browser at the line number where the generated error appears and inspecting that line in the code. Later, you'll see that the PHPEclipse plug-in can be of great assistance during development and debugging by underlining syntax errors on the fly and marking syntax errors with a red "x" when saving the file.
Let’s first look at how to enable error reporting and set the level of error reporting in the php.ini file. You'll then learn how to override these settings in Apache's configuration files.
Error reporting for PHP
There are many configuration settings in the php.ini file. You should already have your php.ini file set up and placed in the appropriate directory, as documented in the instructions for installing PHP and Apache 2 on Linux (see Resources). There are two configuration variables that you should be aware of when debugging PHP applications. Here are the two variables and their default values:
Copy code The code is as follows:
display_errors = Off
error_reporting = E_ALL
You can find it by searching for them in the php.ini file The current default values of these two variables. The purpose of the display_errors variable is obvious - it tells PHP whether to display errors. The default value is Off. However, to make the development process easier, set this value to On:
Copy code The code is as follows:
display_errors = On
error_reporting variable The default value is E_ALL. This setting will show everything from bad coding practices to harmless tips to errors. E_ALL is a bit too granular for development purposes, as it also displays hints on the screen for small things (such as variables not being initialized), which messes up the browser's output. I only want to see errors and bad coding practices, but not harmless tips. So, please replace the default value of error_reporting with the following value:
Copy code The code is as follows:
error_reporting = E_ALL & ~E_NOTICE
重新启动 Apache,就全部设置好了。接下来,将学习如何在 Apache 上做同样的事。
服务器上的错误报告
依赖于 Apache 正在做的工作,在 PHP 中打开错误报告可能没法工作,因为在计算机上可能有多个 PHP 版本。有时很难区分 Apache 正在使用哪个 PHP 版本,因为 Apache 只能查看一个 php.ini 文件。不知道 Apache 正在使用哪个 php.ini 文件配置自己是一个安全问题。但是,有一种方法可以在 Apache 中配置 PHP 变量,从而保证设置了正确的出错级别。
而且,最好知道如何在服务器端设置这些配置变量,以否决或抢占 php.ini 文件,从而提供更高级别的安全性。
在配置 Apache 时,应该已经接触过
要做在 php.ini 文件中已经做过的事,请把下列各行添加到 httpd.conf,覆盖任何 php.ini 文件:
复制代码 代码如下:
php_flag display_errors on
php_value error_reporting 2039
这会覆盖在 php.ini 文件中为 display_errors 已经设置的标志,以及 error_reporting 的值。值 2039 代表 E_ALL & ~E_NOTICE。如果愿意采用 E_ALL,请把值设为 2047。同样,还是要重启 Apache。
接下来,要在服务器上测试错误报告。
测试错误报告
如果启动了错误报告,会节约许多时间。PHP 中的错误会指向代码中的错误。请创建一个简单的 PHP 文件 test.php,并像清单 1 所示一样定义它。
清单 1. 一个Debugging summary for PHP programmers的简单 PHP
复制代码 代码如下:
<?php
print("The next line generates an error.<br>");
printaline("PLEASE?");
print("This will not be displayed due to the above error.");
?>
第一个 print() 语句会向 Web 浏览器显示它的内容。但是第二个语句会Debugging summary for PHP programmers并在 Web 页面上显示。这造成最后一个 print() 语句不起作用,如图 1 所示。
图 1. Debugging summary for PHP programmers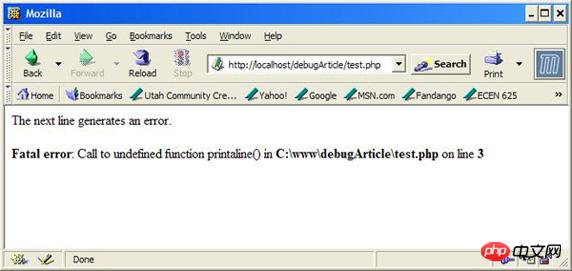
现在开启了错误报告!接下来,用 print 语句帮助调试应用程序。
介绍 print 语句
因为应用程序中的功能性 bug 不会产生错误,所以在所有调试策略中,关于如何正确地放置和使用 print 或 die 语句来调试 PHP 应用程序的知识是一种很好的资产。可以用 print 语句在代码中缩小对问题语句的定位,这些语句在语法上没有错误,也不是 bug,但是从代码的功能上看是 bug。这些是最难发现和调试的 bug,因为它们不会抛出错误。惟一知道的就是在浏览器上显示的内容不是想要的内容,或者想要保存在数据库中的内容根本没有保存。
假设正在处理通过 GET 请求发送过来的表单数据,想向浏览器显示信息,但是出于某种原因,数据没有正确地提交,或者不能正确地从 GET 请求中读出。要调试这类问题,重要的是用 print() 或 die() 语句知道变量的值是什么。
die() 语句会中止程序执行,并在 Web 浏览器上显示文本。如果不想注释掉代码,而且只想显示到出错之前的信息和出错信息,不想显示后面的信息,那么 die() 语句特别有用。
让我们在 PHP 中用 print 语句来测试这个概念
使用 print 语句进行调试
在我作程序员的那些时候,当我在 Linux® 上开发应用程序时,没有方便的 GUI 可以告诉我 bug 在哪,我迅速地发现我在程序中放的 print 语句越多,我在应用程序中把 bug 的范围缩小到一行的机会越大。请创建另一个 PHP 文件 test2.php,并像清单 2 所示的那样定义它。
清单 2. 显示通过 GET 提交的所有变量
复制代码 代码如下:
<?php
$j = "";
print("Lets retrieve all the variables submitted to this ");
print("script via a GET request:<br>");
foreach($_GET as $key => $i){
print("$key=$j<br>");
}
if($_GET['Submit'] == "Send GET Request")
$j = "done!<br>";
?>
<form method="GET">
Name: <input name="name"><br>
Email: <input name="email" size="25"><br>
<input name="Submit" type="submit" value="Send GET Request">
</form>
您可能会非常容易地发现清单 2 中的 bug!您很棒!但请注意这是一个非常简单的脚本,只是作为使用 print 语句进行调试而展示的一个例子而已。这个脚本只是提取 GET 请求中的所有变量,如果有,就把它们显示在浏览器上。还提供了一个表单,用 GET 请求向服务器发送变量以进行测试。请看输出,如图 2 所示。
图 2. test2.php 的输出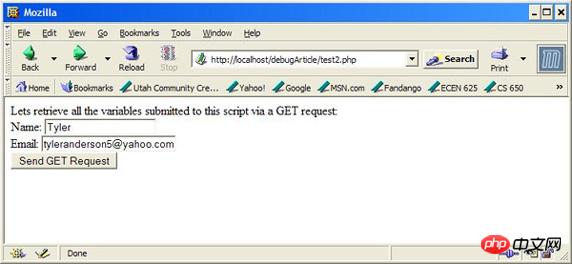
现在单击 Send GET Request 按钮,请注意只有 <span style="font-family:新宋体">$_GET</span> 请求的键显示在浏览器上,而正确的值都没显示。可以在循环中放一个 print 语句,检验在 <span style="font-family:新宋体">foreach</span> 循环中每个元素中是否确实存在数据。请参阅清单 3。
清单 3. 用 print 语句验证代码的功能
复制代码 代码如下:
...
foreach($_GET as $key => $i){
print("Correct data? " . $_GET[$key] . "<br>");
print("$key=$j<br>");
}
...
放进去的 print 语句是粗体。注意,现在已经知道在 Web 浏览器上显示的 $key 值是正确的,但是由于某些原因,值没有正确地显示。请看新的输出,如图 3 所示。
图 3. 修改后的 test2.php 的输出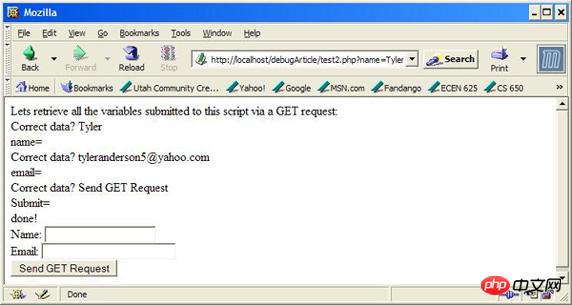
现在已经知道应用程序正确地从 <span style="font-family:新宋体">GET</span> 请求接收到了变量,那么肯定是在代码中有 bug。查看之后注意到,用来显示值的变量 <span style="font-family:新宋体">$j</span> 是错误的。在 <span style="font-family:新宋体">foreach</span> 语句中指定的是 <span style="font-family:新宋体">$i</span>,所以它肯定会有正确的值,但是无意之中输入了 <span style="font-family:新宋体">$j</span>。所以通过把 <span style="font-family:新宋体">$j</span> 替换成 <span style="font-family:新宋体">$i</span>,迅速地修正了错误,重新载入页面之后,就看到了正确的输出,如图 4 所示。
图 4. 修正后的 test2.php 的输出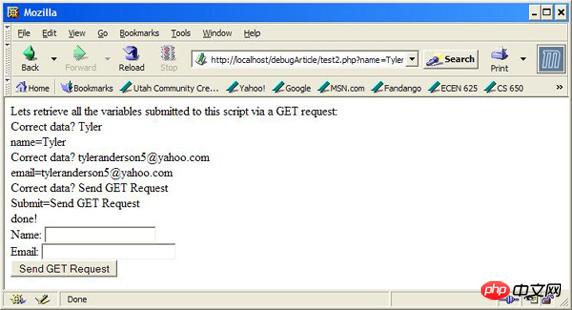
现在可以删除或注释掉刚才添加的 print 语句了,因为已经发现了代码中的 bug。注意,这只是在调试应用程序时可能遇到的许多错误中的一个很小的子集。对于使用数据库时可能遇到的问题,一个好的解决方案是输出 SQL 语句,以确保执行的 SQL 就是想要执行的。
现在要来看看如何使用 Eclipse IDE 和 PHPEclipse 插件及调试器扩展进一步在调试历程中提供帮助。
使用 PHPEclipse
您可能用过 Eclipse,但是可能不熟悉它。请参阅 参考资料 获得 Eclipse 平台的介绍。
用于 Eclipse 的 PHPEclipse 插件是用来开发 PHP 应用程序的一个流行工具。请启动 Eclipse 并把工作区目录指定为 Apache 的 www 目录(在我的机器上是 c:\www)。现在单击 File > New > Project。会弹出 New Project 向导。双击 PHP 文件夹并选择 PHP Project。单击 Next,输入项目名称 debugArticle,并单击 Finish。
如果把 Web 服务器设置为在端口 80 上侦听,那么不需要做任何修改。否则,请转到 Navigator 窗口,在 PHP 项目 debugArticle 上右击,选择 Properties,然后单击 PHP Project Settings。单击 Configure Workspace Settings 然后修改合适的 localhost 或者添加 Web 服务器侦听的端口(例如 http://localhost:8080)。单击 Apply 完成设置。
Navigator 窗口应当显示项目和一个 .project 文件。在项目上右击,就像前面做的那样,只是这次选择 New > PHP File。用想要创建的 PHP 文件的名称 test3.php 替换 *.php,然后单击 Finish。在 Eclipse IDE 中应当出现一个新文件。可能需要导航到窗口底部的 PHP 浏览器来查看 PHP 文件的当前输出(参见图 5)。
图 5. Eclipse 的 PHPEclipse 插件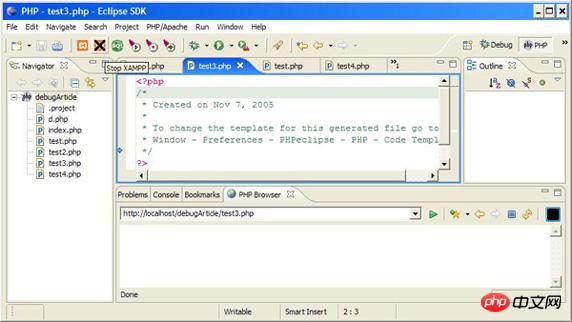
注意,只有 Windows® 的用户可以像清单 5 所示的那样使用 PHP 浏览器。通过打开独立浏览器窗口并把浏览器指向测试脚本所在目录,也可以使用同样的功能。
现在来演示这个应用程序,证明它的强大能力。
在 “使用调试器” 一节中,将学习如何用 Eclipse、PHPEclipse 和前面下载的调试器 PHP 扩展来调试 PHP 应用程序。先从学习如何使用它的语法解析功能开始。
语法解析和加下划线
先从查看 PHPEclipse 如何提供帮助调试 PHP 应用程序的实时语法解析功能开始。要看这个特性的实际应用,先从在 Eclipse 中定义 test3.php 开始,如下所示。
<?php
print(,"Hello World!");
?>
Copy after login |
注意,在清单 4 中加下划线的两个字符在 Eclipse 中加了下划线,提示语法不正确。按 Ctrl+S 保存文件,会在 Eclipse 中显示解析错误:在代码中与解析错误对应的行上会加上红 “x”,如图 6 所示。
图 6. Debugging summary for PHP programmers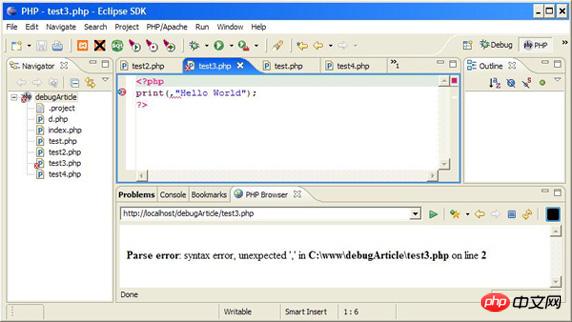
现在演示 PHP 浏览器。这个窗口提供了当前 PHP 脚本的预览,如图 6 所示。
从上面定义的 test3.php 中删除逗号(<span style="font-family:新宋体">,</span>)。按 Ctrl+S 保存文件,然后观察 PHP 浏览器窗口的更新,显示了 Hello World(参见图 7)。
图 7. 在 PHPEclipse 中预览 PHP 脚本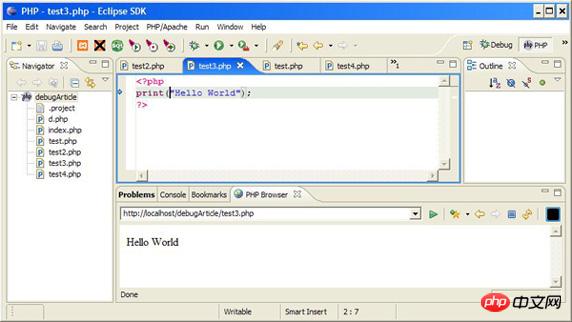
下面是用调试器在 PHP 中设置断点。
使用调试器
使用调试器,可以设置断点并查看 PHP 代码到所设断点之前的浏览器输出。然后可以继续代码的执行并查看到下一断点之前的浏览器输出,然后再到下一个,直到 PHP 脚本完成。
现在把 “设置” 一节中在 php.ini 中注释掉的行取消注释,并重新启动 Apache。现在装入了调试器,Eclipse 能够和它挂上了。
现在在 Eclipse 中设计调试环境。请创建新的 test4.php 文件,先保持为空。现在单击 Run > Debug。在左侧面板中选择 PHP DBG Script,并单击 New。现在转到 File 选项卡,输入当前项目 debugArticle 以及想要调试的文件 test4.php。现在转到 Environment 选项卡,然后再到 Interpreter 子选项卡。在 PHP 的安装目录中找到 php.exe 文件(我的是 c:\apps\php5.0.3\php.exe)。现在单击 Remote Debug 子选项卡,选择 Remote Debug,如果没有使用 Windows,请取消 “Open with DBGSession URL in internal browser box” 复选框。把 Remote Source 路径设置成与要测试的 PHP 脚本的绝对路径(不是 Web 路径)相同(我的设置是 c:\www\debugArticle\test4.php)。现在单击 Debug。
现在应当装入 Debug 透视图,如图 8 所示。否则,请单击 Window > Open Perspective > Other,并选择 Debug。
图 8. Eclipse 中的 Debug 透视图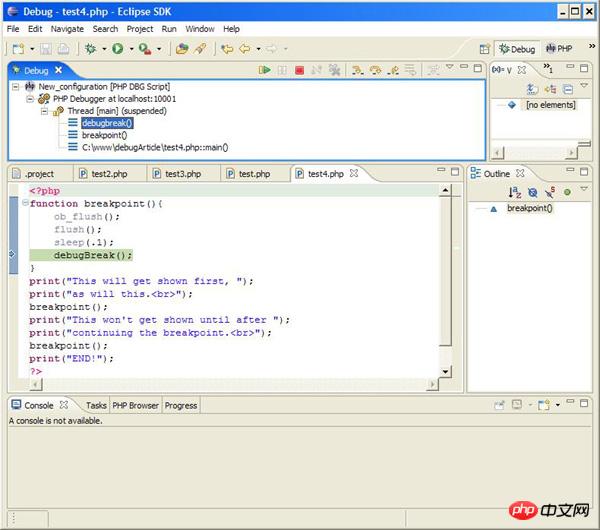
现在可以设置断点了。
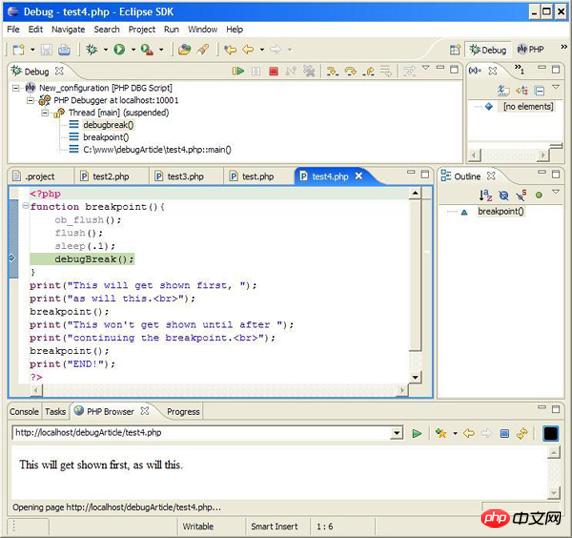
对于本文中使用的插件和扩展的版本,断点功能是必需的,因为 PHP 在把输出发送到浏览器之前会缓冲它。除此之外,需要做的不仅仅是设置一个断点把当前显示数据刷新到 Web 浏览器,所以要像下面和图 8 所示那样定义 test4.php。
清单 4. 设置和创建断点
<?php
function break-point(){
ob_flush();
flush();
sleep(.1);
debugBreak();
}
print("This will get shown first, ");
print("as will this<br>");
breakpoint();
print("This won't get shown until after ");
print("continuing the break-point<br>");
breakpoint();
print("END!");
?Copy after login
After you've written the code like in Listing 4, you can open a browser and point to test4.php, or you can view a PHP browser window (mine was http://localhost/debugArticle/test4.php). Each time a file is entered and saved, the debugging sequence is already started in the PHP browser window. If you are not using Windows, view test4.php through your browser. After saving the file, continue code execution with F8 or click Run > Resume. Keep doing this until the last line of output is
Please note Figure 9 How to show execution as suspended in the Debug window.
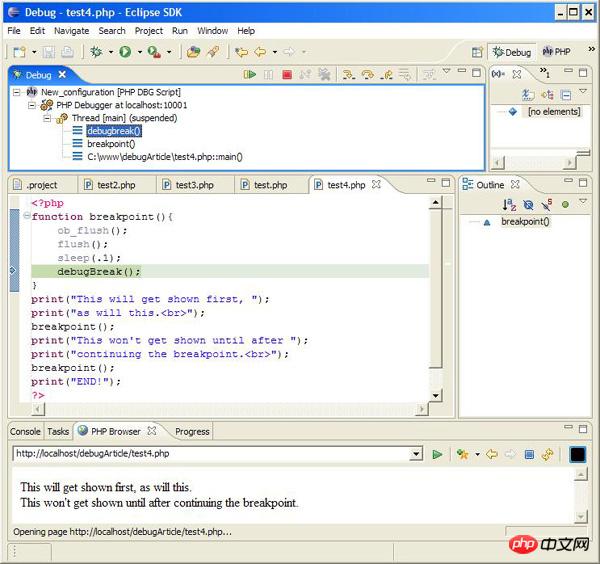
The Debug window in Figure 10 still shows execution as pending, while the second set of data is displayed in the PHP browser.
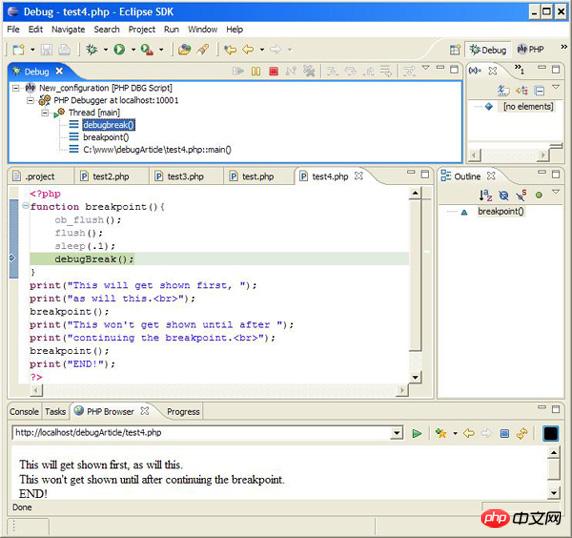
Note that the code in the Debug window of Figure 11 does not Hang again and the entire script has been executed, as shown in Figure 11 for the PHP browser. Now that you've seen the advantages of developing with PHPEclipse and the debugger extension, it's hard to imagine doing it without it. Conclusion Now that error reporting, print statements, PHPEclipse, and debugger extensions have been added to PHP's debugging technology set, you can reduce the number of lines of code by number of errors and become a more effective PHP coder. See Resources for some PHP tutorials on which you can test these new skills. Download Sample code for PHP Debugging References Learn
##About the author
The above is the detailed content of Debugging summary for PHP programmers. For more information, please follow other related articles on the PHP Chinese website!
Related labels:
Previous article:PHP's treasure house directory PEAR
Next article:PHP configuration php-fpm startup parameters and configuration details
Statement of this Website
The content of this article is voluntarily contributed by netizens, and the copyright belongs to the original author. This site does not assume corresponding legal responsibility. If you find any content suspected of plagiarism or infringement, please contact admin@php.cn
Latest Articles by Author
Latest Issues
Related Topics
More>
Popular Recommendations
Popular Tutorials
More>
Latest Downloads
More>
| ||||||


![[Web front-end] Node.js quick start](https://img.php.cn/upload/course/000/000/067/662b5d34ba7c0227.png)


