How to dynamically transfer data to highcharts in php
This article mainly introduces the relevant knowledge of dynamically transferring data to highcharts through php. Has very good reference value.
1: In daily work, when displaying data, the json string is obtained directly through the interface provided by the background for display. Today someone asked how to demonstrate the requested dynamic data locally.
2: Set up the environment locally, I use WampServer, Download address: http://xiazai.jb51.net/201703/yuanma/WampServer_2.5_jb51.rar, The browser opens localhost, and the file is stored in the wamp/www directory

3: PHP code, there is no process of writing real-time requests to the database.
<?php $b = array( array('name'=>'北京', 'y'=>20.2), array('name'=>'上海', 'y'=>9.6), array('name'=>'武汉', 'y'=>16.6), ); $data = json_encode($b); echo($data); ?>
4: html file
<!DOCTYPE HTML>
<html>
<head>
<meta charset="utf-8"> <meta name="viewport" content="width=device-width, initial-scale=1">
<meta http-equiv="x-ua-compatible" content="ie=edge">
<link rel="icon" href="https://static.jianshukeji.com/hcode/images/favicon.ico">
<style>
</style>
<script src="https://img.hcharts.cn/jquery/jquery-1.8.3.min.js"></script>
<script src="https://img.hcharts.cn/highcharts/highcharts.js"></script>
<script src="https://img.hcharts.cn/highcharts/modules/exporting.js"></script>
<script src="https://img.hcharts.cn/highcharts-plugins/highcharts-zh_CN.js"></script>
</head>
<body>
<p id="container" style="min-width:400px;height:400px"></p>
<script>
$(function () {
$.getJSON('http://localhost/index-1.php', function (csv) {
console.log(csv)
$('#container').highcharts({
chart: {
plotBackgroundColor: null,
plotBorderWidth: null,
plotShadow: false
},
title: {
text: ''
},
tooltip: {
pointFormat: '{series.name}: <b>{point.percentage:.1f}%</b>'
},
plotOptions: {
pie: {
allowPointSelect: true,
cursor: 'pointer',
dataLabels: {
enabled: true,
color: '#000000',
connectorColor: '#000000',
formatter: function() {
return '<b>'+ this.point.name +'</b>: '+ this.percentage +' %';
}
}
}
},
series: [{
type: 'line',
name: '',
data: csv,
}]
});
});
});
</script>
</body>
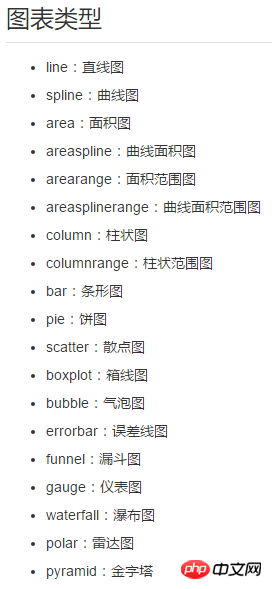
</html>5: Here, introduce the js file. When you need to display the same json string as different graphics, modify the type attribute in the series and modify the data column parameter plotOptions in highcharts to display different graphics. Graphics, highcharts can display graphic types.

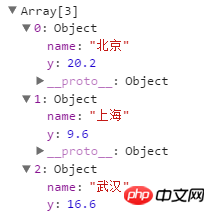
php returns data format: [{"name":"\u5317\u4eac","y":20.2},{"name":"\ u4e0a\u6d77","y":9.6},{"name":"\u6b66\u6c49","y":16.6}], when the requested data needs to be processed, such as when only part of the data is needed , you can process the passed array when requesting data through get:

The above is the entire content of this article, I hope it will help everyone learn Helps.
Related recommendations:
PHPAcquisition of login session
Usage analysis of bind_param() function in php
PHPHow to determine whether the custom function is submitted for Get, Post and Ajax
The above is the detailed content of How to dynamically transfer data to highcharts in php. For more information, please follow other related articles on the PHP Chinese website!

Hot AI Tools

Undresser.AI Undress
AI-powered app for creating realistic nude photos

AI Clothes Remover
Online AI tool for removing clothes from photos.

Undress AI Tool
Undress images for free

Clothoff.io
AI clothes remover

Video Face Swap
Swap faces in any video effortlessly with our completely free AI face swap tool!

Hot Article

Hot Tools

Notepad++7.3.1
Easy-to-use and free code editor

SublimeText3 Chinese version
Chinese version, very easy to use

Zend Studio 13.0.1
Powerful PHP integrated development environment

Dreamweaver CS6
Visual web development tools

SublimeText3 Mac version
God-level code editing software (SublimeText3)

Hot Topics
 1669
1669
 14
14
 1428
1428
 52
52
 1329
1329
 25
25
 1273
1273
 29
29
 1256
1256
 24
24
 PHP: A Key Language for Web Development
Apr 13, 2025 am 12:08 AM
PHP is a scripting language widely used on the server side, especially suitable for web development. 1.PHP can embed HTML, process HTTP requests and responses, and supports a variety of databases. 2.PHP is used to generate dynamic web content, process form data, access databases, etc., with strong community support and open source resources. 3. PHP is an interpreted language, and the execution process includes lexical analysis, grammatical analysis, compilation and execution. 4.PHP can be combined with MySQL for advanced applications such as user registration systems. 5. When debugging PHP, you can use functions such as error_reporting() and var_dump(). 6. Optimize PHP code to use caching mechanisms, optimize database queries and use built-in functions. 7
 PHP vs. Python: Understanding the Differences
Apr 11, 2025 am 12:15 AM
PHP and Python each have their own advantages, and the choice should be based on project requirements. 1.PHP is suitable for web development, with simple syntax and high execution efficiency. 2. Python is suitable for data science and machine learning, with concise syntax and rich libraries.
 PHP and Python: Comparing Two Popular Programming Languages
Apr 14, 2025 am 12:13 AM
PHP and Python each have their own advantages, and choose according to project requirements. 1.PHP is suitable for web development, especially for rapid development and maintenance of websites. 2. Python is suitable for data science, machine learning and artificial intelligence, with concise syntax and suitable for beginners.
 PHP in Action: Real-World Examples and Applications
Apr 14, 2025 am 12:19 AM
PHP is widely used in e-commerce, content management systems and API development. 1) E-commerce: used for shopping cart function and payment processing. 2) Content management system: used for dynamic content generation and user management. 3) API development: used for RESTful API development and API security. Through performance optimization and best practices, the efficiency and maintainability of PHP applications are improved.
 The Enduring Relevance of PHP: Is It Still Alive?
Apr 14, 2025 am 12:12 AM
PHP is still dynamic and still occupies an important position in the field of modern programming. 1) PHP's simplicity and powerful community support make it widely used in web development; 2) Its flexibility and stability make it outstanding in handling web forms, database operations and file processing; 3) PHP is constantly evolving and optimizing, suitable for beginners and experienced developers.
 PHP and Python: Different Paradigms Explained
Apr 18, 2025 am 12:26 AM
PHP is mainly procedural programming, but also supports object-oriented programming (OOP); Python supports a variety of paradigms, including OOP, functional and procedural programming. PHP is suitable for web development, and Python is suitable for a variety of applications such as data analysis and machine learning.
 PHP vs. Other Languages: A Comparison
Apr 13, 2025 am 12:19 AM
PHP is suitable for web development, especially in rapid development and processing dynamic content, but is not good at data science and enterprise-level applications. Compared with Python, PHP has more advantages in web development, but is not as good as Python in the field of data science; compared with Java, PHP performs worse in enterprise-level applications, but is more flexible in web development; compared with JavaScript, PHP is more concise in back-end development, but is not as good as JavaScript in front-end development.
 PHP and Python: Code Examples and Comparison
Apr 15, 2025 am 12:07 AM
PHP and Python have their own advantages and disadvantages, and the choice depends on project needs and personal preferences. 1.PHP is suitable for rapid development and maintenance of large-scale web applications. 2. Python dominates the field of data science and machine learning.


