This article will introduce how to use phpstorm's own server to run php projects (detailed pictures and texts), which has certain reference value. Friends in need can refer to it. I hope it will be helpful to everyone.

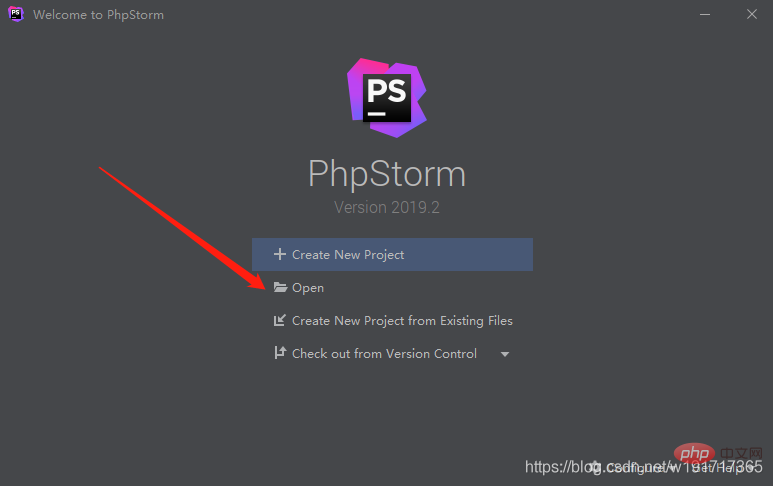
First use phpstorm to open the project

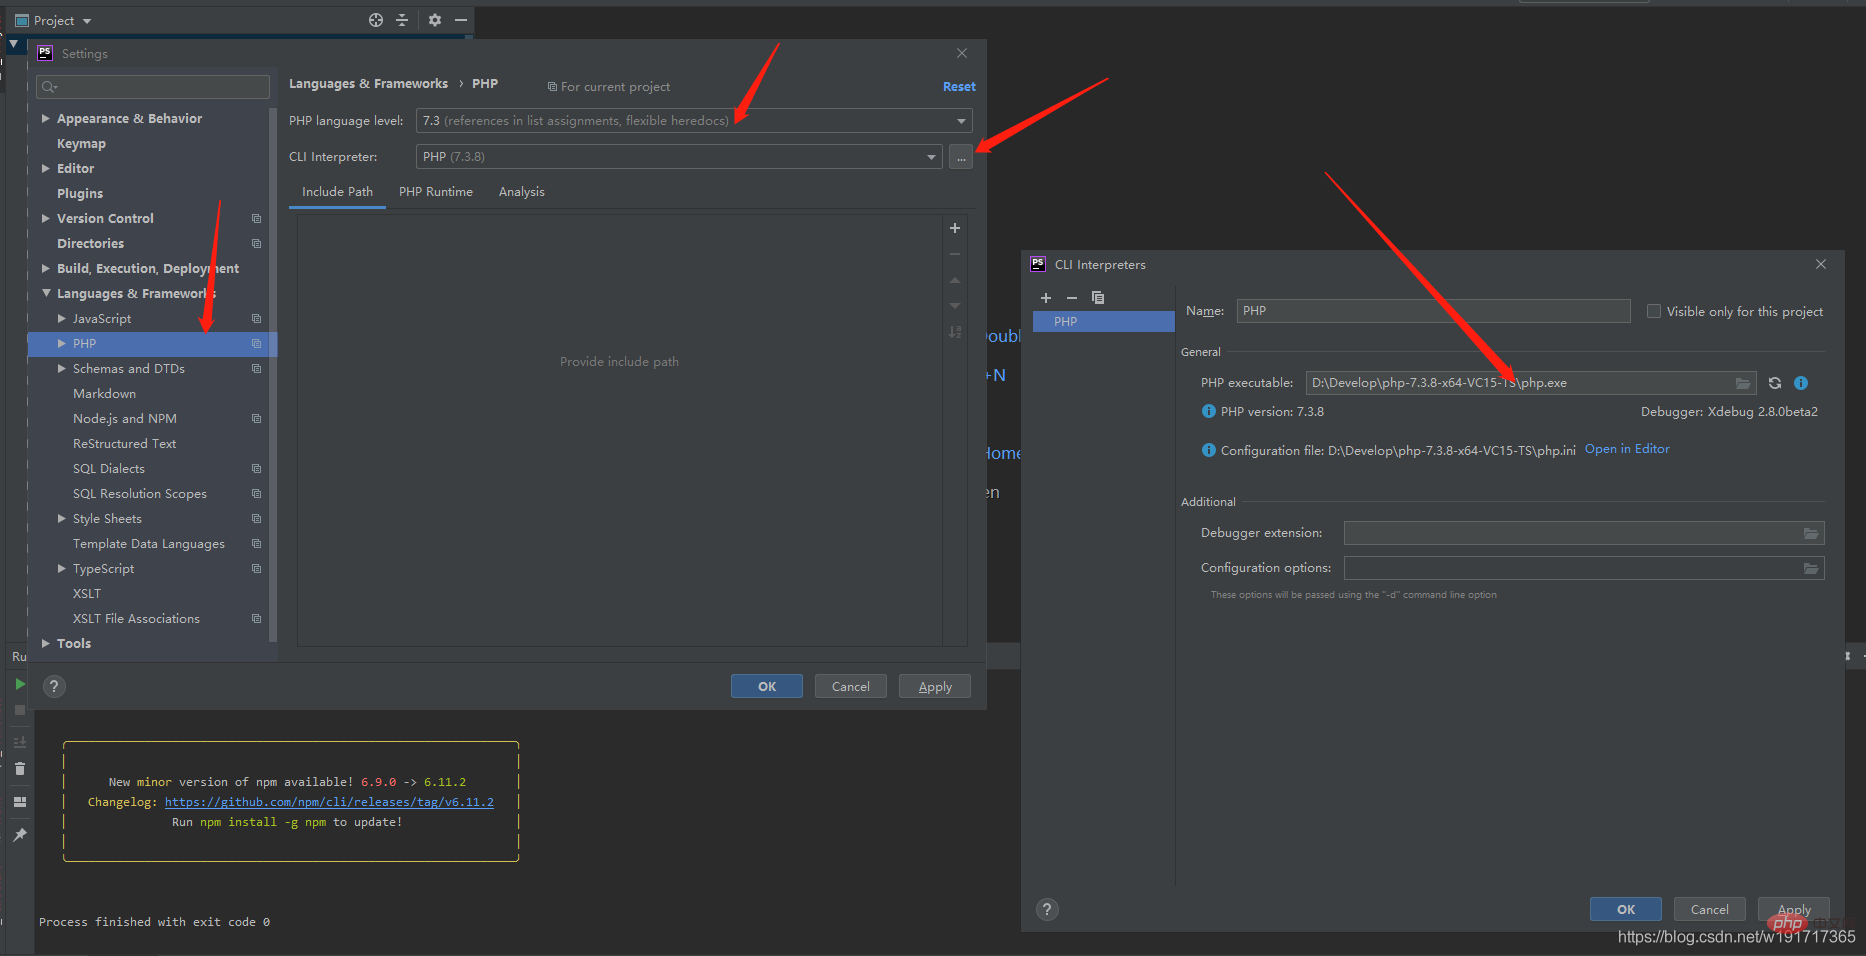
Then menu barfile-- >settings-->languages&framework
First click php, then click the three dots after cli interpreter, and a new window will pop up (name whatever you want) Select php.exe in the local php directory in executable and click ok to return to the previous page. Select the corresponding php version in php langusge level and click ok. In this way, the php interpreter of phpstorm is configured

## Then click
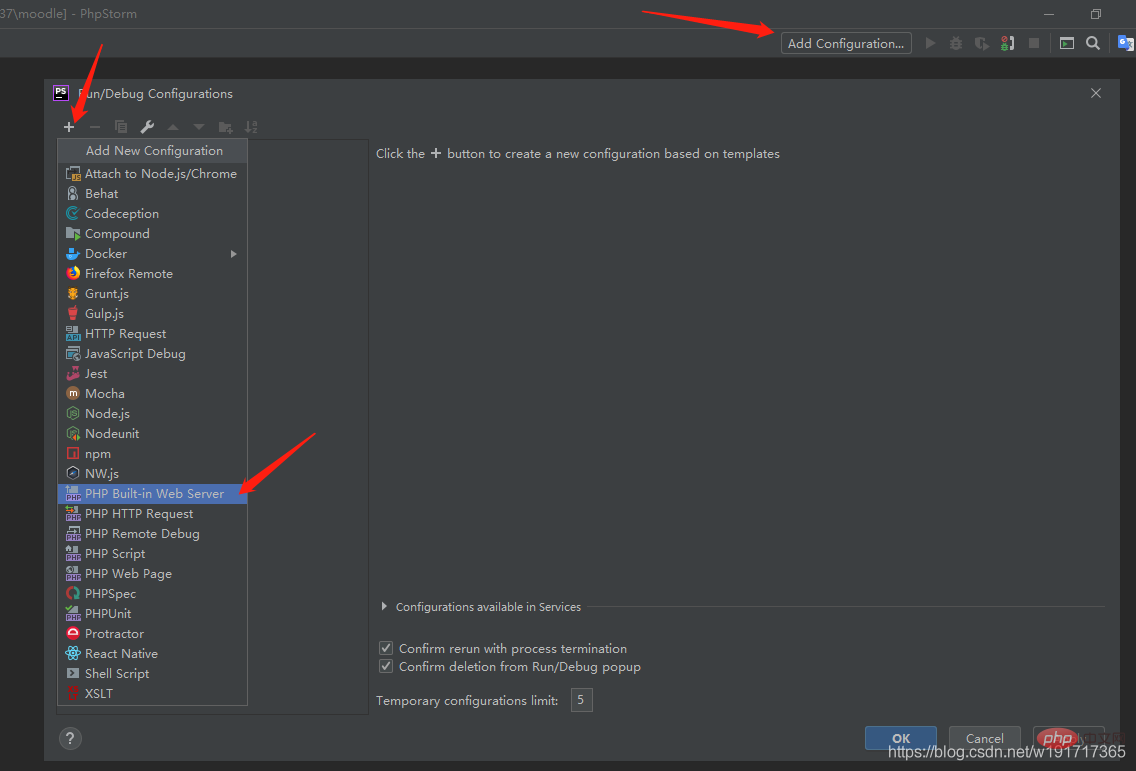
addconfiguration on the main interface, click the upper left corner number in the pop-up window, and then select php builder in web server

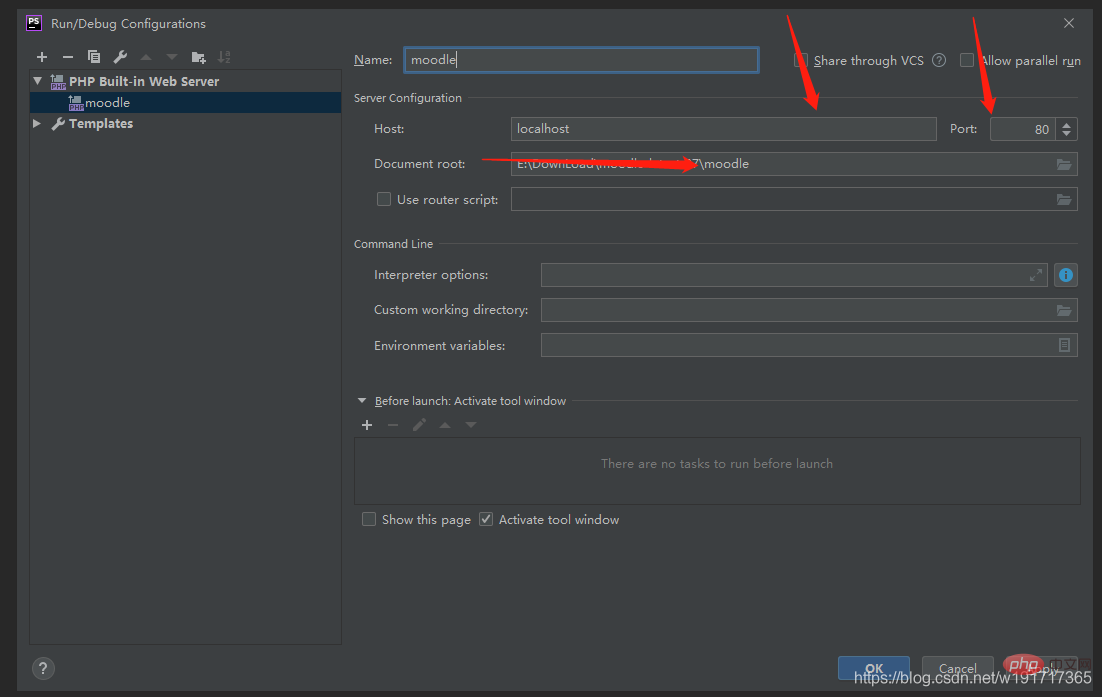
The name can be chosen casually. The host and port are the access addresses when your project is started. Customize and access the project through the browser. The host and port access
document roots are by default the address you selected when opening the project. Generally, there is no need to change it. Click OK after configuration.

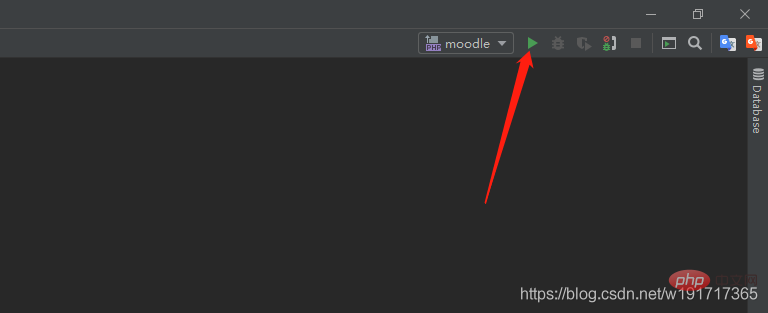
Click the arrow on the right, and then your project will start running. Enter the host and port you just configured in the browser to access the project

Then there is the debug configuration. Let’s briefly talk about it here (it matches the built-in server of phpstorm. If you use other servers, you don’t need to read further).
First of all, you need to download the corresponding xdebuge plug-in according to the local PHP environment, place it in the ext directory under PHP, and configure the corresponding parameters in php.ini (there are a lot of online tutorials, so I won’t go into details), chrome plug-in The xdebug helper itself is under the chrome store (the chrome store cannot be accessed in China), mainly on the phpstorm side
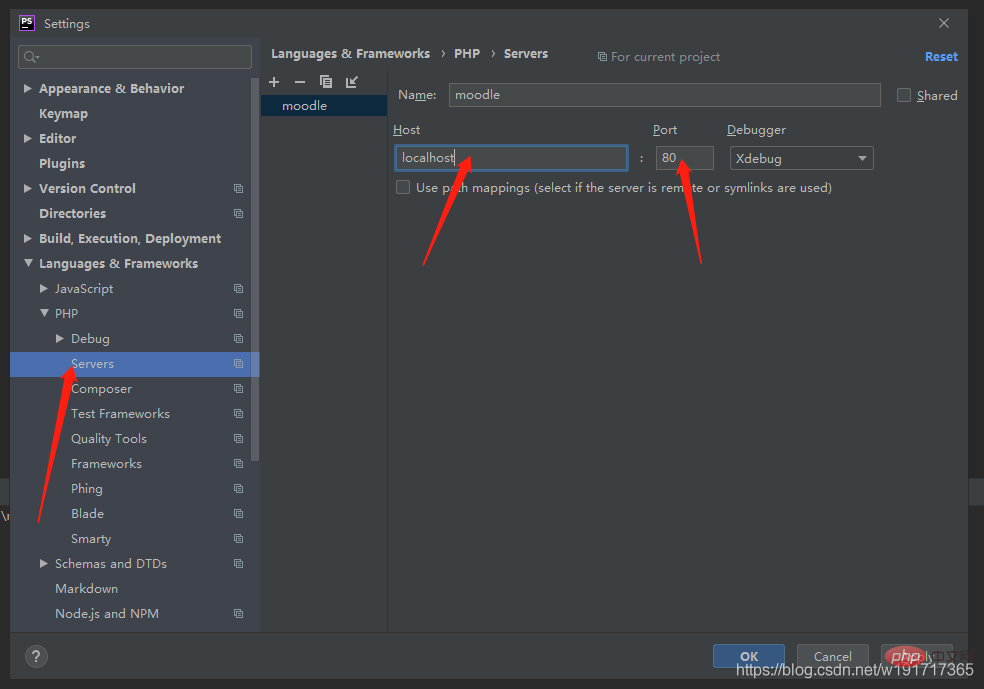
or the menu bar-->file-->settings-->langgues&frameworks-->php servers under. Dot number to add a listening server
The name can be chosen casually. The host and port are consistent with the host and port used when the project is started. Just use xdebug as the debugger (xdebug or zend debug mainly depends on the php debug plug-in you use. ) Then click ok, the debug related configuration is completed

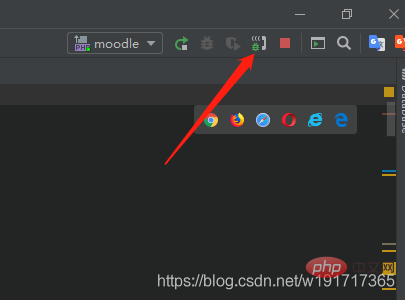
Click on the phone receiver on the right, and then start monitoring

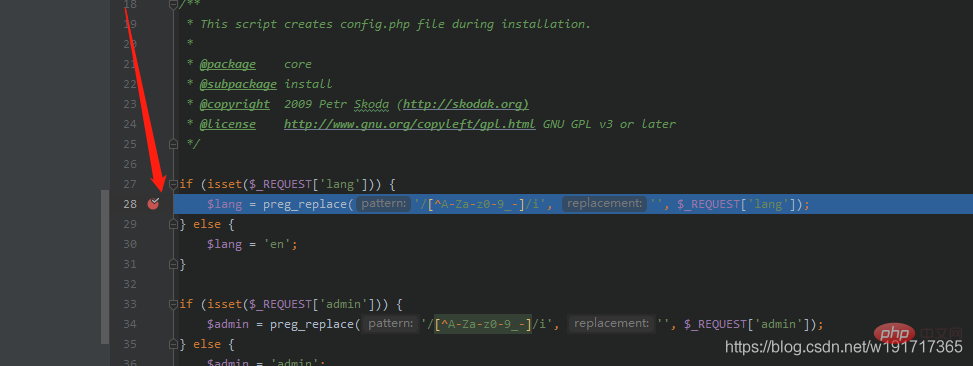
Set a breakpoint, and then visit the interface where the breakpoint is located, you can jump into phpstorm (chrome’s xdebug helper plug-in must also be turned on of course)

Recommended learning : "
PHP Video Tutorial"
The above is the detailed content of How to use phpstorm's own server to run php projects (detailed graphic and text explanation). For more information, please follow other related articles on the PHP Chinese website!


