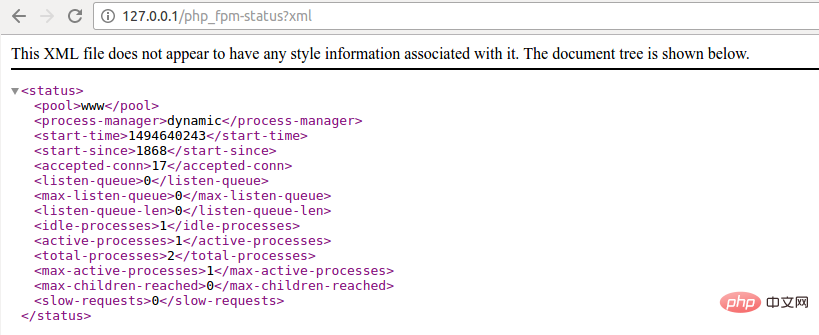
php-fpm status can view summary information and detailed information
nginx.conf configuration file
server {
    listen       80;
    server_name  localhost;

    index index.php index.html;
    root  /home/tinywan/zabbix;

    location / {
        try_files $uri $uri/ /index.php?$args;
    }

    location ~ \.php$ {
        fastcgi_pass   unix:/var/run/php7.0.9-fpm.sock;
        fastcgi_index  index.php;
        fastcgi_param  SCRIPT_FILENAME  $document_root$fastcgi_script_name;
        include        fastcgi_params;
    }

    location /nginx_status {
          stub_status on;
          access_log off;
          allow 127.0.0.1;
          ##allow 192.168.249.0/24;
          deny all;
    }

    location ~ /php_fpm-status$ {
            allow 127.0.0.1;
            #deny all;
            fastcgi_param SCRIPT_FILENAME $fastcgi_script_name;
            include fastcgi_params;
            fastcgi_pass unix:/var/run/php7.0.9-fpm.sock;
    }
}Enable php-fpm status function
tinywan@tinywan:/opt/php-7.0.9$ cat /opt/php-7.0.9/etc/php-fpm.d/www.conf | grep status_path
;pm.status_path = /status

The default is /status, but of course it can be changed to other values, such as /ttlsa_status, etc.
vim /opt/php-7.0.9/etc/php-fpm.d/www.conf
pm.status_path = /php_fpm-status           #去掉了前面的;注释符,并更名为php_fpm-status
After modifying php-fpm.conf, use service php-fpm reload to reload the configuration file
tinywan@tinywan:/opt/php-7.0.9$ sudo /opt/php-7.0.9/sbin/php-fpm
tinywan@tinywan:/opt/php-7.0.9$ ps -aux | grep php-fpm
root       2769  4.1  0.1 212532 14676 ?        Ss   09:50   0:00 php-fpm: master process (/opt/php-7.0.9/etc/php-fpm.conf)
tinywan    2770  3.2  0.1 212532 11084 ?        S    09:50   0:00 php-fpm: pool www
tinywan    2771  5.9  0.1 212532 11084 ?        S    09:50   0:00 php-fpm: pool www
tinywan    2773  0.0  0.0  15984   944 pts/21   S+   09:50   0:00 grep --color=auto php-fpm
Use the curl command to view the status of php-fpm
tinywan@tinywan:/usr/local/nginx$ curl localhost/php_fpm-status
pool:                 www
process manager:      dynamic
start time:           13/May/2017:09:50:43 +0800
start since:          986
accepted conn:        2
listen queue:         0
max listen queue:     0
listen queue len:     0
idle processes:       1
active processes:     1
total processes:      2
max active processes: 1
max children reached: 0
slow requests:        0
php-fpm status can view summary information and detailed information. The detailed information has more information about each php-fpm process than the summary information. It also supports multiple format output, such as xml, html and json. By default Just use the if command respectively:
json format
tinywan@tinywan:~$ curl localhost/php_fpm-status?json
{"pool":"www","process manager":"dynamic","start time":1494640243,

"start since":1609,"accepted conn":13,"listen queue":0,"max listen queue":0,

"listen queue len":0,"idle processes":1,"active processes":1,"total processes":2,

"max active processes":1,"max children reached":0,"slow requests":0}xml format
tinywan@tinywan:~$ curl localhost/php_fpm-status?xml
<?xml version="1.0" ?>
<status>
<pool>www</pool>
<process-manager>dynamic</process-manager>
<start-time>1494640243</start-time>
<start-since>1692</start-since>
<accepted-conn>15</accepted-conn>
<listen-queue>0</listen-queue>
<max-listen-queue>0</max-listen-queue>
<listen-queue-len>0</listen-queue-len>
<idle-processes>1</idle-processes>
<active-processes>1</active-processes>
<total-processes>2</total-processes>
<max-active-processes>1</max-active-processes>
<max-children-reached>0</max-children-reached>
<slow-requests>0</slow-requests>
</status>
All formats:
Examples for summary status page:
http://127.0.0.1/php_fpm-status
http://127.0.0.1/php_fpm-status?json
http://127.0.0.1/php_fpm-status?html
http://127.0.0.1/php_fpm-status?xml

Example for detailed status page:
http://127.0.0.1/php_fpm-status?full
http://127.0.0.1/php_fpm-status?json&full
http://127.0.0.1/php_fpm-status?html&full
http://127.0.0.1/php_fpm-status?xml&full
Browser access xml file screenshot

The meaning of php-fpm status
| ##Field | Meaning |
|---|---|
| pool | php-fpm pool name, In most cases, it is www |
| process manager | process management method. Most of them are dynamic nowadays. Do not use it. static |
| start time | php-fpm last started time |
| start since | How many seconds has php-fpm been running |
| accepted conn | The number of requests received by the pool |
| listen queue | The number of connections in the waiting state. If it is not 0, you need to increase the number of php-fpm processes |
| max listen queue | The maximum number of connections waiting from php-fpm startup to now |
| listen queue len | Size of sockets waiting for connection queue |
| idle processes | Number of idle processes |
| active processes | Number of active processes |
| total processess | Total processes |
| The maximum number of processes that have been active since php-fpm was started | |
| When pm tried to start more children processes, it reached the limit of the number of processes and recorded once. If it is not 0, you need to increase the maximum number of php-fpm pool processes | |
| When the php-fpm slow-log function is enabled, if a php-fpm slow request occurs, this counter will increase, generally inappropriate Mysql queries This value will be triggered |
The above is the detailed content of Teach you how to use php-fpm status to view detailed information. For more information, please follow other related articles on the PHP Chinese website!