
How to debug html with vscode?
Use Debugger for Chrome for debugging
First download the corresponding plug-in
Ctrl Shift x to open the plug-in store, search chrome to see the plug-in, click to install ->Just reload
There are two configuration methods for this plug-in, one is debugging based on local files, and the other is debugging based on server-client mode.
Local file debugging starts chrome to read local files, and then directly renders the page based on the file
server-client loads the file to be debugged into the service container (such as tomcat and the like) ), all documents are provided as a service.
Chrome accesses the file based on the url address of the service and then loads it into the browser.
Related recommendations: "vscode tutorial"
The two configuration methods are introduced below
1.1.1. Debugging based on local file configuration
Create a new launch.json file under the .vscode folder and add the configuration as follows
{
  "version": "0.2.0",
  "configurations": [
    {
      "type": "chrome",
      "request": "launch",
      "name": "Launch Chrome 本地调试",
      "url": "http://localhost:8080",
      "webRoot": "${workspaceFolder}",
      "file": "${file}"
    }
  ]
}Configuration explanation:
${file} means opening the current file
${workspaceRoot} represents the current loading root directory of vscode
launch represents a new chrome process to load the file
Attach relative to launch, indicating that the current file is loaded into the existing chrome process
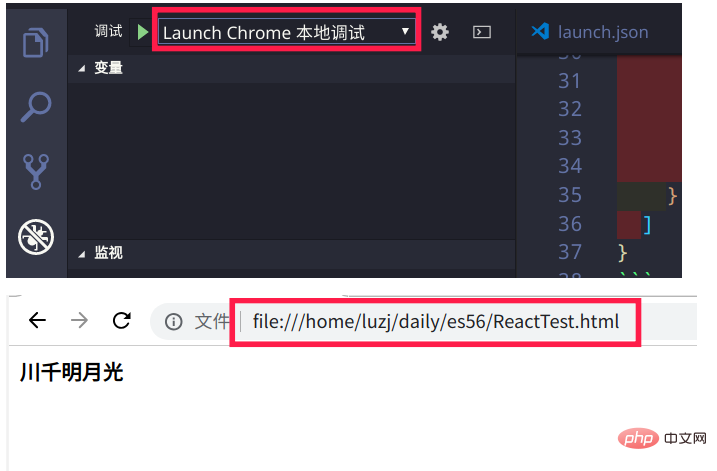
Select the [Launch Chrome local debugging] option in the debugging menu bar, click [f5] or [fn f5], you can see the page

You can see it Above the url search bar is an address starting with file:///, which indicates that the file is read locally. After that, all
html files can be debugged like this
1.1.2. Debugging based on server configuration
1.1.2.1. Start the server
Based on the server-client method, the file must be loaded into the server container first. Tomcat is not used here, but the
python method is used.
In the bash terminal, cd into the root directory of vscode, for example, mine is ~/daily, run the following command
cd ~/daily
# Load files in the current directory Enter the container, the external port is 8080, host is the local ip, and localhost can be used for local access
python3 -m http.server 8080
1.1.2.2. Configure vscode
Add the following configuration information to the launch.json file,
{
"type": "chrome",
"request": "launch",
"name": "Launch Chrome from http",
"url": "http://localhost:8080/${relativeFile}",
"webRoot": "${workspaceFolder}"
},${workspaceFolder} represents the path relative to the root directory
Then select [Launch Chrome from http], click [f5] or [fn f5] You can see that chrome has loaded the file. At the same time, we can also see from the address in the search bar that chrome uses the http protocol to access files this time

1.2. Debugging using Nodejs
Debugging using Nodejs The configuration method is basically the same as chrome, but the type is changed, as follows
{
    "type": "node",
    "request": "launch",
    "name": "Node Launch Program",
    "program": "${workspaceFolder}/${relativeFile}"
},Select [Node Launch Program] in the debugger menu bar, and then click [f5], the debugging information will be displayed below
On the debugging console, screenshots will not be taken.
If nodeJs is not installed, you can run the following command on a debian computer.
apt install nodejs npm
Generally, using apt to install may cause the version to be lagging behind. You can Use source code installation, official installation manager or configure ppa.
I choose to configure ppa, using the LTS version of 10.x
$ cat /etc/apt/sources.list.d/nodesource.list
deb https://deb.nodesource.com/node_10.x sid main
deb-src https://deb.nodesource.com/node_10.x sid main
The above is the detailed content of How to debug html with vscode. For more information, please follow other related articles on the PHP Chinese website!


