VSCode debugging tutorial (2): step-by-step debugging
It is important to navigate between the code you want to inspect. It would be tedious and unnecessary to go through every line of code. The debugger provides a convenient way to see what's important and jump out of unimportant blocks of code. Let's see how to enter, skip, and exit functions while debugging!
In Previous article, we studied the VS Code debugger, added breakpoints in the code, and also viewed the local status.
This time, we'll learn how to step through code line by line and how to jump in and out of function calls.
Get the code
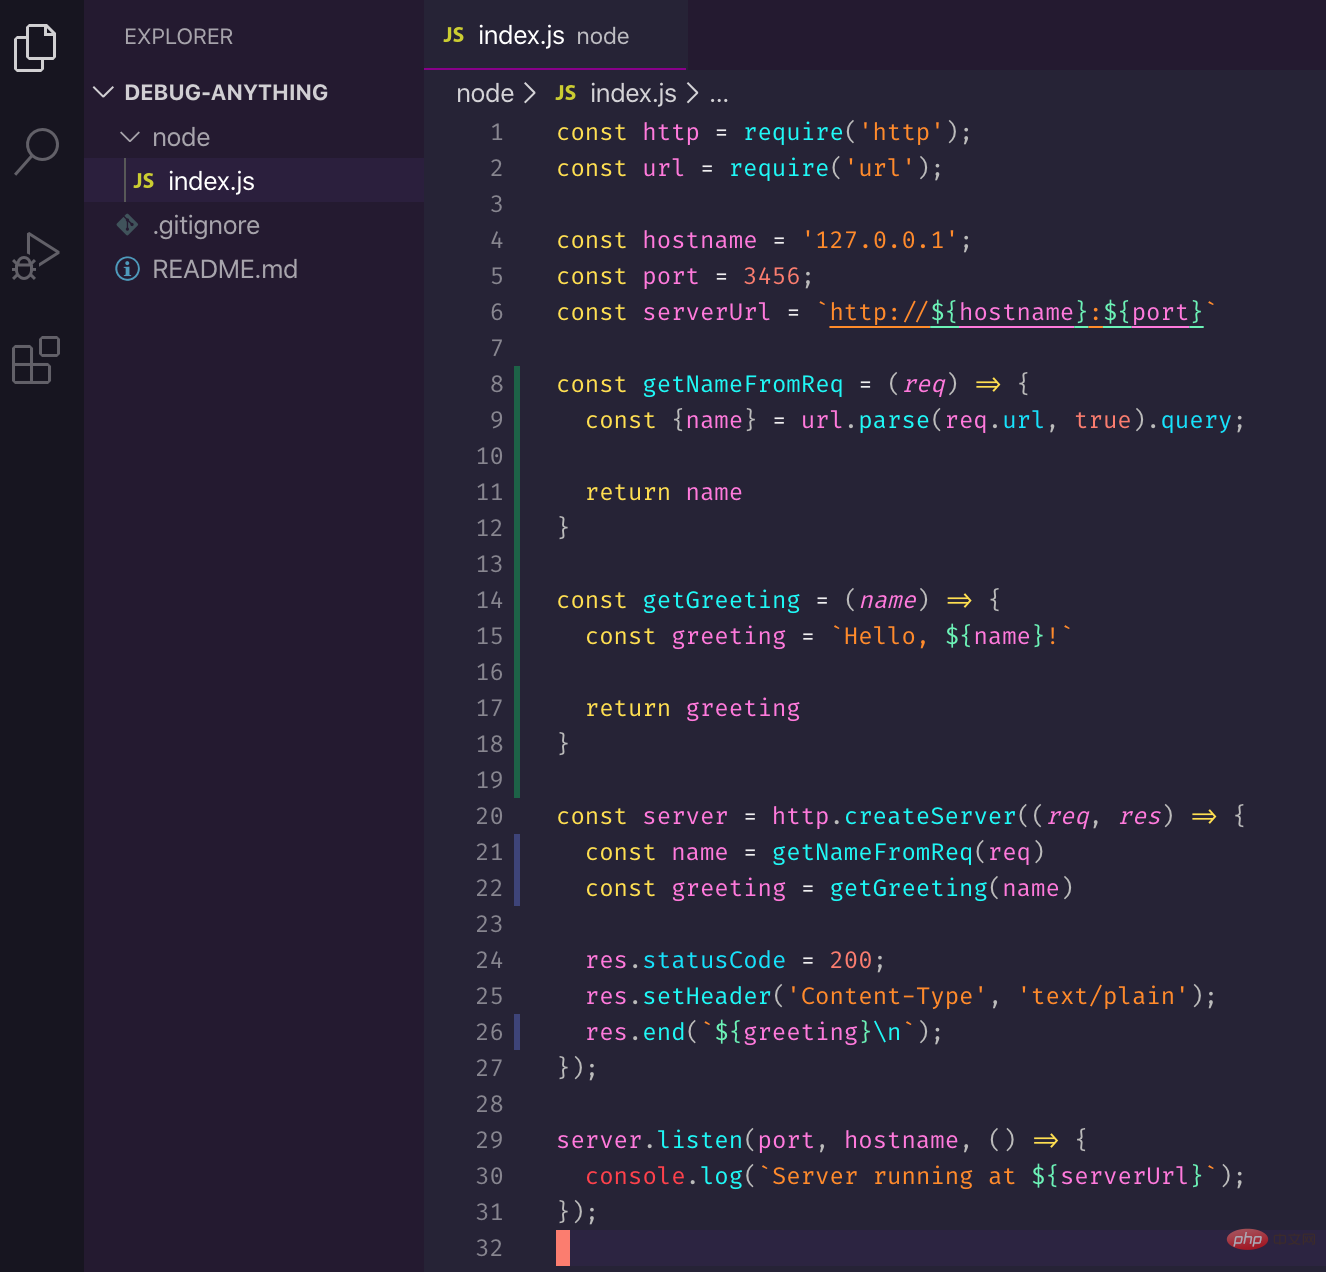
First, let’s make the last server modification more complex. Add two extra functions: one to get the name from the request and another to generate the greeting.
You can paste the following code into index.js.
const http = require('http');
const url = require('url');

const hostname = '127.0.0.1';
const port = 3456;
const serverUrl = `http://${hostname}:${port}`

const getNameFromReq = (req) => {
  const {name} = url.parse(req.url, true).query;

  return name
}

const getGreeting = (name) => {
  const greeting = `Hello, ${name}!`

  return greeting
}

const server = http.createServer((req, res) => {
  const name = getNameFromReq(req)
  const greeting = getGreeting(name)

  res.statusCode = 200;
  res.setHeader('Content-Type', 'text/plain');
  res.end(`${greeting}\n`);
});

server.listen(port, hostname, () => {
  console.log(`Server running at ${serverUrl}`);
});The code of this series can be obtained at https://github.com/thekarel/debug-anything
Start the debugger
Let's start the debugger: Use the debug toolbar or press F5 and select Node.js:

You should be able to access http://127.0.0.1:3456/?name=Coco and See the greeting.
If you like the command line, you can also use curl http://127.0.0.1:3456\?name\=Coco to access. Okay, now that the server is up and running, let's add a breakpoint. The debugger will not start without a breakpoint:

Add a breakpoint on line 21:
const name = getNameFromReq(req)
Step by Step debugging
Trigger the pair againhttp://127.0.0.1: 3456/?name=Coco, the debugger will be activated and stop at line 21 of the code:
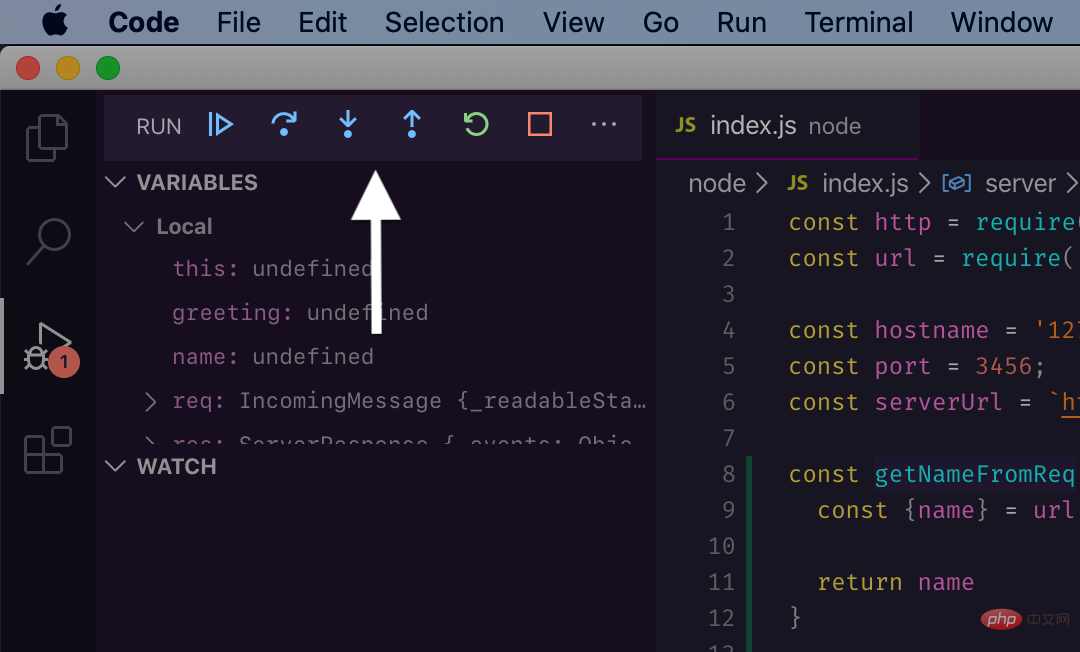
##pretty! Now let's focus on the
Debug Toolbar:

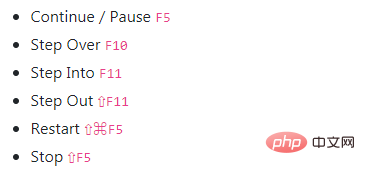
still execute all code as usual. The debugger won't make you bored, and you'll be able to complete your main work faster.
Continue
Continue will run the code until the next breakpoint or the end of the program. One way to debug is to add multiple breakpoints on the relevant lines beforehand and jump between them with continue:
Step Over
You can think of Step Over as stepping through the function line by line, but without entering the function call. Use it if you are not interested in the internal logic of the function call in the current line, but just want to see how local variables change over time, for example:
declarative code.
Step Into
When a line calls a function that interests you and you want to dig deeper, you can use Step Into. Once inside the code block, you can debug as usual (using continue, step, etc.).
Observe how we skip getNameFromReq and then enter getGreeting:

Step Out
Step Out is the opposite of Step In: if you are no longer interested in a function, you can leave it. Using "Step out" will run the rest of the function's code in one go.
Check the difference between these two functions through debugging. We execute the first function line by line, but exit the second function early:

Now, you should have a better understanding of the debugger toolbar, how to focus on the important things and skip the irrelevant parts. Not only will these commands save you time, they will make the entire debugging job more enjoyable! Why not try it in your project?
VSCode debugging tutorial series:
English original address: https://charlesagile.com/debug-javascript-typescript-debugger-navigating-with-steps
Author: Charles Szilagyi
Recommended related tutorials: vscode introductory tutorial
The above is the detailed content of VSCode debugging tutorial (2): step-by-step debugging. For more information, please follow other related articles on the PHP Chinese website!

Hot AI Tools

Undresser.AI Undress
AI-powered app for creating realistic nude photos

AI Clothes Remover
Online AI tool for removing clothes from photos.

Undress AI Tool
Undress images for free

Clothoff.io
AI clothes remover

Video Face Swap
Swap faces in any video effortlessly with our completely free AI face swap tool!

Hot Article

Hot Tools

Notepad++7.3.1
Easy-to-use and free code editor

SublimeText3 Chinese version
Chinese version, very easy to use

Zend Studio 13.0.1
Powerful PHP integrated development environment

Dreamweaver CS6
Visual web development tools

SublimeText3 Mac version
God-level code editing software (SublimeText3)

Hot Topics
 1664
1664
 14
14
 1423
1423
 52
52
 1318
1318
 25
25
 1269
1269
 29
29
 1248
1248
 24
24
 What computer configuration is required for vscode
Apr 15, 2025 pm 09:48 PM
VS Code system requirements: Operating system: Windows 10 and above, macOS 10.12 and above, Linux distribution processor: minimum 1.6 GHz, recommended 2.0 GHz and above memory: minimum 512 MB, recommended 4 GB and above storage space: minimum 250 MB, recommended 1 GB and above other requirements: stable network connection, Xorg/Wayland (Linux)
 How to define header files for vscode
Apr 15, 2025 pm 09:09 PM
How to define header files using Visual Studio Code? Create a header file and declare symbols in the header file using the .h or .hpp suffix name (such as classes, functions, variables) Compile the program using the #include directive to include the header file in the source file. The header file will be included and the declared symbols are available.
 vscode terminal usage tutorial
Apr 15, 2025 pm 10:09 PM
vscode built-in terminal is a development tool that allows running commands and scripts within the editor to simplify the development process. How to use vscode terminal: Open the terminal with the shortcut key (Ctrl/Cmd). Enter a command or run the script. Use hotkeys (such as Ctrl L to clear the terminal). Change the working directory (such as the cd command). Advanced features include debug mode, automatic code snippet completion, and interactive command history.
 Where to write code in vscode
Apr 15, 2025 pm 09:54 PM
Writing code in Visual Studio Code (VSCode) is simple and easy to use. Just install VSCode, create a project, select a language, create a file, write code, save and run it. The advantages of VSCode include cross-platform, free and open source, powerful features, rich extensions, and lightweight and fast.
 Common commands for vscode terminal
Apr 15, 2025 pm 10:06 PM
Common commands for VS Code terminals include: Clear the terminal screen (clear), list the current directory file (ls), change the current working directory (cd), print the current working directory path (pwd), create a new directory (mkdir), delete empty directory (rmdir), create a new file (touch) delete a file or directory (rm), copy a file or directory (cp), move or rename a file or directory (mv) display file content (cat) view file content and scroll (less) view file content only scroll down (more) display the first few lines of the file (head)
 How to solve the problem of vscode Chinese annotations becoming question marks
Apr 15, 2025 pm 11:36 PM
How to solve the problem that Chinese comments in Visual Studio Code become question marks: Check the file encoding and make sure it is "UTF-8 without BOM". Change the font to a font that supports Chinese characters, such as "Song Style" or "Microsoft Yahei". Reinstall the font. Enable Unicode support. Upgrade VSCode, restart the computer, and recreate the source file.
 vscode Previous Next Shortcut Key
Apr 15, 2025 pm 10:51 PM
VS Code One-step/Next step shortcut key usage: One-step (backward): Windows/Linux: Ctrl ←; macOS: Cmd ←Next step (forward): Windows/Linux: Ctrl →; macOS: Cmd →
 vscode terminal command cannot be used
Apr 15, 2025 pm 10:03 PM
Causes and solutions for the VS Code terminal commands not available: The necessary tools are not installed (Windows: WSL; macOS: Xcode command line tools) Path configuration is wrong (add executable files to PATH environment variables) Permission issues (run VS Code as administrator) Firewall or proxy restrictions (check settings, unrestrictions) Terminal settings are incorrect (enable use of external terminals) VS Code installation is corrupt (reinstall or update) Terminal configuration is incompatible (try different terminal types or commands) Specific environment variables are missing (set necessary environment variables)


