In the previous article "Sharing practical Excel skills: Two methods of adding background images to tables", we learned how to use table background images. Today we are going to talk about the statistics table and learn to do multi-factor ranking statistics table by watching the World Cup. Come and take a look!

The fierce battle of the World Cup, which is held every four years, is in full swing. Every fan cheers for his favorite team and is more concerned about the situation of this team's group. With the end of the first round, the group stage reaches a climax, and every goal scored by a team in the same group can affect the overall outcome. Although media information is now very developed, current news and development forecasts can be found everywhere, but it is undoubtedly very convenient if you can have a spreadsheet that can calculate and predict the group ranking results after inputting the data. I will share it with you today. Such a game performance statistics table.
The final effect of the table is as shown below:

#Function: As long as you enter the game results in the yellow area, various indicators and Final ranking.
Value:
①Real-time statistics of battle data
②Predicted ranking
Of course, the more important significance is: learn through the design ideas of this table There are many detailed knowledge points that you can learn from if you encounter problems in calculating comprehensive rankings at work. Let’s take a look at the specific production process.
Because the structures of each group are completely the same, we only take the data of Group A as an example for explanation. The production of the entire table is divided into three stages: determining the overall idea, layout design and formula design.
1. Determine the overall idea
Before designing the table, it is necessary to sort out the relevant rules and requirements and clarify what foundations can be used Data, what results are needed in the end, and then design the intermediate links.
In this performance statistics table, our basic data are the two numbers after each game (the number of goals scored by both sides); the final result required is the group ranking.
How to get the ranking based on the results of each game, you also need to understand the ranking rules:

The above picture is the official explanation, which is quite complicated. Calculation rules, we can summarize this rule into the following points:
①Judge the victory or defeat of each team according to the needs of each game, a win will be scored with 3 points, a tie will be scored with 1 point, and a loss will be scored with 0 points ;
② When the points are the same, the ranking will be based on the goal difference (the goal difference is the number of goals scored - the number of goals conceded);
③ When the goal difference is still the same, the ranking will be based on the number of goals scored .
④If the number of goals is still the same, the judgment must be based on the foul situation of the game.
Because our basic data is only the number of goals scored by both sides in each game, points 1 to 3 can be achieved, but point 4 cannot be achieved.
Next, you need to design the form based on this information.
2. Typesetting design
1. Store numbers separately
Things to master in typesetting design The first principle is that a cell only stores one type of data. For example, if the score of 5:2 is placed in one cell, the two numbers need to be extracted separately and then calculated during later statistical analysis, which is very inconvenient. Therefore, this issue needs to be considered when designing tables. Let’s take a look at how it is handled:

In order to facilitate everyone’s understanding, we display the cell borders. You can clearly see that in fact, each score is Three cells are used to store the results of the two teams separately from the colon. The four cells with the slash in the middle and the team name in the fourth row are all processed using merged cells.

By rationally using merged cells, it not only meets the requirement of storing numbers separately, but also meets the visual needs, and the results of the game can be seen intuitively.
2. Reasonable use of auxiliary columns
The second principle of typesetting design is to simplify the input steps and simplify the calculation process. This can be achieved with the help of auxiliary columns and formulas. For example, in this table, you need to fill in the score in the yellow area below the diagonal line. The score above the diagonal line is referenced with the formula:

In order to count the number of wins, draws and losses for each team, some auxiliary columns are used:

Regarding auxiliary columns, some friends may find it too troublesome and always hope to get the results directly using formulas. In fact, this is a misunderstanding. In some template tables with complex logical relationships or many calculation steps, making good use of auxiliary columns can simplify the difficulty of formulas, reduce the amount of calculations, and facilitate the maintenance of the table during use, because the calculation process is all implemented through auxiliary columns. , if you need to adjust the calculation method somewhere, you only need to change the corresponding place.
The above is an explanation of the design of this performance statistics table. It seems like a lot, but it is actually not difficult. Next, let’s take a look at what formulas and functions are used in this table.
3. Formula design
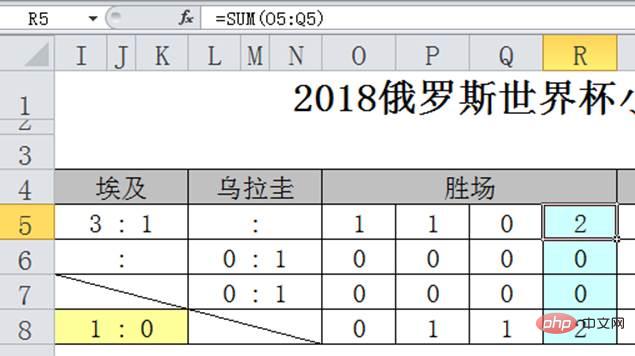
1. Judgment of victory: =IF(F5>H5 ,1,0)

Use the IF function to directly compare F5 and H5. When F5 is greater than H5, it is a win, and you get 1, otherwise you get 0.
Calculation of the number of wins: =SUM(O5:Q5)

Sum the previous data directly.
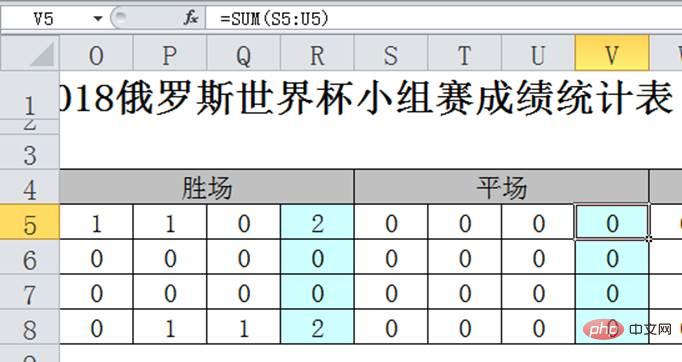
2. Judgment of flat field: =IF(AND(F5=H5,F5" "),1,0)

It is a little different from winning games. When judging a draw, a condition needs to be added, that is, the comparison will only be done when the number of goals is not empty, so the AND function is added to make the judgment. It is considered a tie only if the two conditions of equal number of goals and not being empty are met at the same time, and is recorded as 1, otherwise it is 0.
Calculation of the number of flat fields:

is also a direct sum.
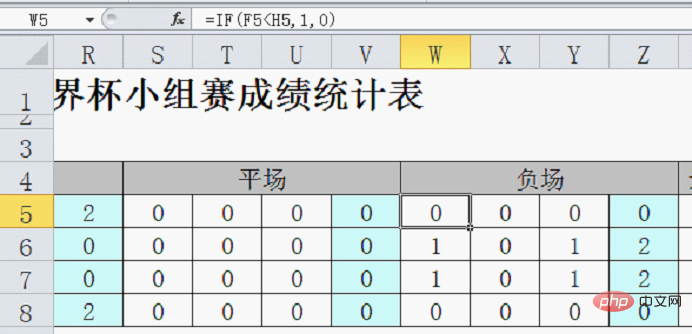
3. Judgment of losing games: =IF(F5

and judgment method of winning games The same thing, just change the greater than sign to less than sign in the formula.
Calculation of the number of negative fields:

Just sum it up directly.
The above part is to convert the results of each game into specific numbers. It seems a bit cumbersome, but it is not difficult. Next, hide the auxiliary column and only display the statistics of wins, draws and losses.

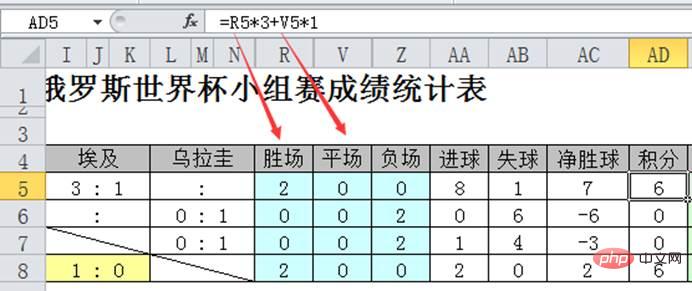
4. Statistics of goals scored, goals conceded and goal difference:
Number of goals: =SUM(F5,I5,L5)
Goals conceded: =SUM(H5,K5,N5)
Goal difference: =AA5-AB5
This part of the formula is very simple, all addition and subtraction operations.

5. Calculation of integrals
According to the rules, a win is worth 3 points, a draw is worth 1 point, and a loss is worth 0 points. The formula for points is: =R5*3 V5*1

At this point, we have calculated all the indicators for calculating the ranking, namely: points, goal difference and number of goals.
In calculating the ranking based on these three indicators Before, a transition was needed to quantify the three indicators according to their respective priorities (weights) and turn them into comparable numbers. This can be achieved by using such a formula in the AF column: =AD5 AC5% AA5 %%, the results are as follows.
Do you think this formula is strange? What does the percent sign mean?
Let’s focus on explaining this formula. Three are used here Cells: AD5 (points), AC5 (goal difference) and AA5 (number of goals)
It is clearly stated in the ranking rules that points are first used. If the points are the same, the goal difference will be judged, and then the number of goals will be judged. So how to transform this sequential comparison of multiple data into a comparison of only one data? You can refer to the method of using weights to calculate multi-factor rankings. For example, the weight of indicator A is 50%, the weight of indicator B is 30%, and the weight of indicator C is 20%, then the comprehensive score is A*0.5 B*0.3 C*0.2, so although there are three A, B, and C Ranking factors, but only the combined scores need to be compared to get the ranking.
At this time, it is necessary to manually specify the weight and convert the data that needs to be compared successively into one data.
Formula=AD5 AC5% AA5%%The original writing should be: =AD5*100 AC5*10 AA5, enter the formula in column AG, the result is as follows.
That is to say, each indicator is expanded by 100 times, 10 times, and 1 times according to priority and then added together so that each indicator will not be at the same number. Instead, they are located in the hundreds, tens and ones digits respectively. This not only ensures the priority of each indicator, but also turns multiple indicators into one data. (Note: The current multiplier setting is only suitable for situations where points, goal difference, and goal data are all less than 10.)
In football matches, the numbers are relatively small (generally less than 10). If you want to calculate If the data magnitude is relatively large, a difference of only 10 times is not enough. A difference of 100 times or 10,000 times is often encountered. In this case, there will be many zeros in the formula. At this time, you can change your thinking and change the expansion to reduction. The function of % is to reduce the data by 100 times, and the function of %% is to reduce the data by 10,000 times. , this is the origin of =AD5 AC5% AA5%%.
After so many steps, it’s finally time to calculate the final ranking. Let’s take a look at the ranking formula.
6. Calculation of ranking
The formula is very simple, it is the standard usage of the rank function: =RANK(AF5,$AF$5:$AF$8)
Let’s review the meaning of the rank function: =rank (data to calculate ranking, area participating in ranking, ascending or descending order) , where the ranking is in descending order when the third parameter is omitted, and the one with the highest score is ranked first.
Finally hide all the auxiliary columns, and a performance statistics table is completed:
4. Summary
You may have a feeling that it is really troublesome to design a template like this. It uses so many auxiliary columns, and the formulas in some places cannot be pulled down. You have to fill them in one by one. Is there no need for auxiliary columns? What about direct pull-down methods?
There is definitely one, but it may not be convenient to use. It will use a lot of array formulas and complex functions. Of course, as far as this form is concerned, there is definitely the possibility of continued optimization. The veteran once spent a week improving a report template for calculating sales rankings, testing and modifying repeatedly during the process. But the user experience is very good, because you only need to fill in the basic data and you can see the most desired results. The intermediate calculation process is all auxiliary columns (stored separately in a sheet) and uses relatively simple functions. , even when modifications are needed, users can solve them themselves.
For report templates, the length of design time is not a measure of quality, but the ease of use and ease of maintenance. I hope you can learn some ideas for designing templates from today's example, which can make your work more efficient and your forms smarter.
Related learning recommendations: excel tutorial
The above is the detailed content of Practical Excel skills sharing: Learn how to make a multi-factor ranking statistical table?. For more information, please follow other related articles on the PHP Chinese website!
 Compare the similarities and differences between two columns of data in excel
 excel duplicate item filter color
 How to copy an Excel table to make it the same size as the original
 Excel table slash divided into two
 Excel diagonal header is divided into two
 Absolute reference input method
 java export excel
 Excel input value is illegal