How to optimize the performance of vue project? The following article will share with you some performance optimization methods that will definitely be used in vue projects. I hope it will be helpful to everyone!

MentionPerformance Optimization Do you remember the interview experience vividly in front of many people? Anyway, in my opinion, performance optimization will always be the King of Popularity in the front-end field.
The project I recently maintained happens to have put a lot of effort in this direction. I would like to share some experience, hoping it will be of some help to everyone!
Since we are talking about performance optimization, there must be a recognized standard. This is what we have heard many timesLighthouse

Many units have their own performance monitoring platforms. We only need to introduce the corresponding sdk, and then we can analyze your performance on the platform Didn’t everyone learn about the performance issues of the page?
In fact, except for demanding businesses that require special customization, in most cases our unit’s performance optimization platform essentially uses a headless browser (Puppeteer) to run Lighthouse.
After understanding the principles of our unit's performance monitoring platform, we can perform targeted performance optimization, that is, programming for Lighthouse
Lighthouse
Lighthouse is an open source automation tool launched by Google Chrome. It can collect multiple modern web page performance indicators, analyze the performance of web applications and generate reports to conduct performance analysis for developers. Optimized provides reference directions.
Speaking ofLighthousehas been integrated in modern Google Chrome

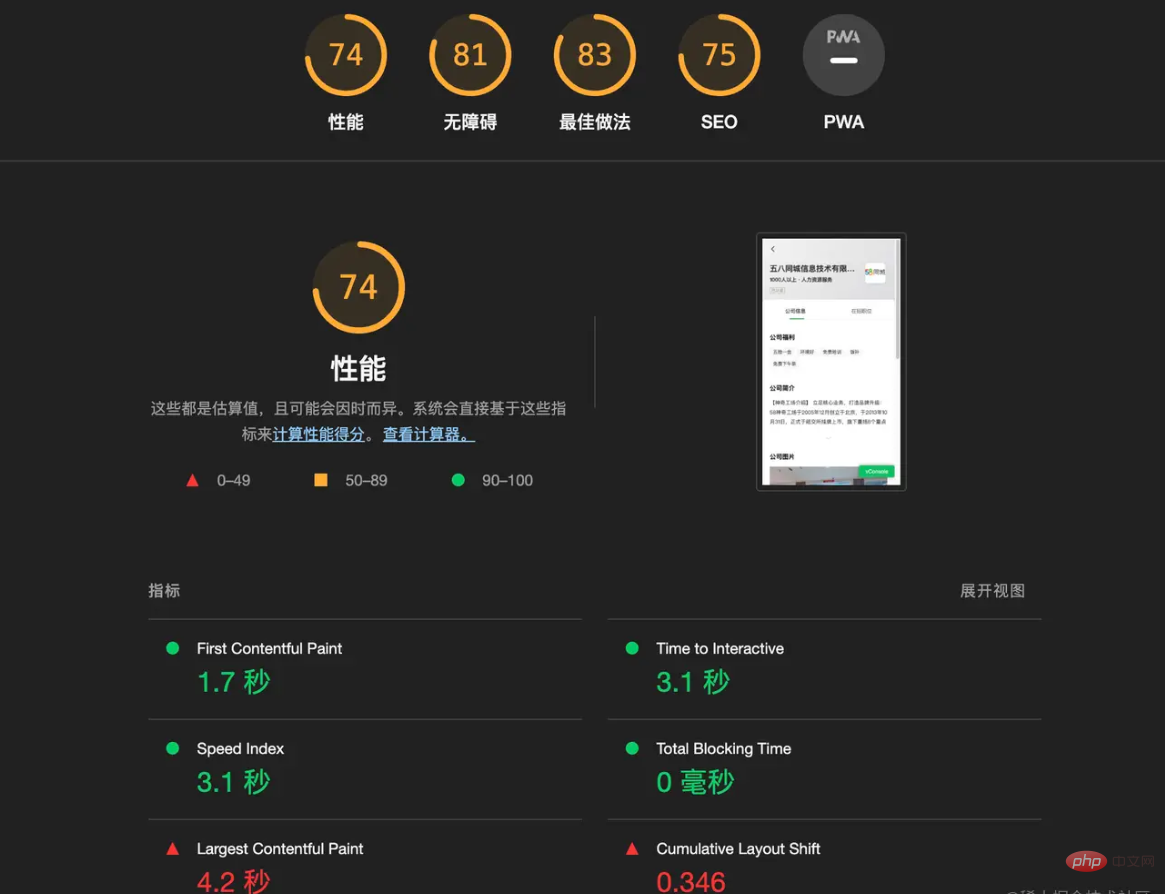
He can analyze our page performance through Several indicators
Lighthouse will measure the following performance indicator items:
First Contentful Paint(First Contentful Paint). That is the point in time when the browser first draws any content (such as text, images, canvas, etc.) to the screen.
Interactive time(Time to Interactive). Refers to the point in time when all page content has been successfully loaded and can respond quickly to user operations.
Speed Index (Speed Index). Measures how quickly content visible above the fold is drawn on the screen. Trying to display as much content as possible during the first loading of the page can often bring a better experience to users, so the smaller the value of the speed indicator, the better.
Total Blocking Time (Total Blocking Time). Refers to the total time between First Contentful Paint (FCP) and Time to Interactive (TTI)
difference between the performance monitoring platform and the local platform, the local system may have to reach 70 points, it is possible to achieve passing status only online. If there is a need for performance optimization, you can handle it as appropriate (but I think passing is enough. After all, there is a saying in college exams: long live 60 points, 61 points are a waste , inheritance cannot be lost, we have to spend more time on more important things!)
lighthouse is that it can find some common performance bottlenecks in your page and make optimization suggestions, such as:
So for these optimization suggestions, we need to do some regular optimization:
Reduce unused javascript
Remove rendering-blocking resources
Image quality compression
Limit the number of fonts used and use as few variants as possible
Optimize the critical rendering path: load only the necessary resources required for the current page rendering, and load secondary resources after the page rendering is completed
We know that there are six performance indicators in lighthouse, and among these six indicators, LCP, FCP, speed index, these The three indexes are particularly important, because under normal circumstances these three indicators will affect the scores of TTI, TBT, and CLS
, so when we optimize, we need to improve LCP, The scores of FCP and speedIndex have been tested. Even an empty page will cause time loss. The initial scores are basically 0.8 seconds
Note: It is worth everyone's attention that we All current tests are based on mobile terminal (the reason why the mobile terminal is used is because of the powerful computing power of PC and there are few performance bottlenecks), and there must be the following content on the page to obtain To score, the content must include one or more of the following
Otherwise there will be the following errors
Next we will start with the three indicators of LCP, FCP and speedIndex
FCP (First Contentful Paint)
As the name suggests, it is First Content Painting, which is the time when the content is first drawn on the page, but because we The pages being developed now are all spa applications, so the initialization at the framework level will definitely have a certain performance loss. Taking the scaffolding built by vue-cli as an example, when I initialize the empty scaffolding, after packaging After uploading to CDN for deployment, FCP will increase from 0.8s to 1.5 seconds. It can be seen that vue's diff is not free and it will also have performance losses. (Learning video sharing: vuejs tutorial)
Before optimizing the content of the page, we declare three premises
The time to improve FCP is actually Optimize Critical Rendering Path
If it is a style file (CSS file), the browser must fully parse it before rendering the page (that's why it is said CSS Render-blocking)
If it is a script file (JavaScript file), the browser must: Stop parsing, download the script, and run it. Only after this can it continue parsing, since JavaScript scripts can change the page content (especially the HTML). (This is why JavaScript blocks parsing)
Based on the above use case tests, we found that no matter how we optimize, the performance loss of the framework itself cannot be erased. The only thing we can do The purpose is to allow the framework to perform initialization earlier and initialize less content. The optimization methods that can be done are as follows:
All js files that are not used for initialization are loaded asynchronously. That is to say, add defer or asnyc, and some third-party plug-ins that require CDN need to be placed at the bottom of the page (because placed at the top, its parsing will prevent the parsing of html, thus Affects the downloading of css and other files, this is also a Yahoo military regulation)
js file unpacking, taking vue-cli as an example, under normal circumstances we can Use cli configuration splitChunks to do code splitting, and move some third-party packages to CDN or unpack them. If there is a route, unpack the route to ensure that each route onlyloads the js code corresponding to the current route
Optimize the file size to reduce the font package, The size of css files and js files (of course these scaffoldings have been done by default)
Optimize the project structure. The initialization of each component has a performance loss. On the basis of ensuring maintainability, try to reduce initialization as much as possible The number of components loaded
Optimization at the network protocol level. This optimization method requires the server to cooperate with the pure front-end and cannot be achieved. In the current era when cloud servers are prevalent, our own Organizations generally enable these optimization methods in the cloud server by default, such as enabling gzip, using cdn, etc.
In fact, let’s talk about it , the core concepts of improving FCP are only the following two Reduce initialization view content and Reduce initial download resource size
##LCP (Largest Contentful Paint)
As the name suggests, it isMaximum content drawing, when to report LCP, the official said this
largest-contentful-paint type PerformanceEntry will be distributed immediately after the first frame is drawn, used to identify the largest content element. However, after subsequent frames are rendered, the browser dispatches another PerformanceEntry when the largest content element changes.
largest-contentful-paint entry, which The ##element attribute usually refers to a <p></p> or <h1></h1>. Then, once the first image has finished loading, the browser will dispatch a second largest-contentful-paint entry whose element attribute will reference <img alt="Collect these Vue project performance optimization methods and you will be able to use them one day!" > . It should be noted that an element can only be considered a maximum content element after rendering is complete and visible to the user. Images that are not yet loaded are not considered "rendered". The same is true for text nodes that use web fonts during the
. In this case, the smaller element may be reported as the largest content element, but once the larger element has finished rendering, it will be reported through another PerformanceEntry object. In fact, the explanation in vernacular is that under normal circumstances, after
will report to LCPUnderstanding this, the optimization method It’s clear, just reduce the size of these resources as much as possible. After testing, after reducing the size of the pictures and video content rendered on the first screen, the overall score improved significantly. Some optimization methods are provided:
SpeedIndex
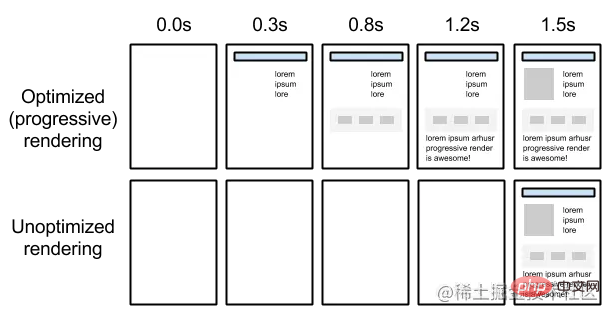
Speed IndexUses the visual progress of visual page loading to calculate the total score for content rendering speed. To do this, you first need to be able to calculate how many sections are "completed" at various points in time during the page load. In WebPagetest, this is done by capturing a video of the page loading in the browser and checking each video frame (10 frames per second in the test with video capture enabled). This algorithm is described below, but for now let's assume we can Assign a complete percentage to each video frame (the number displayed under each frame)The above is the official explanation of the calculation method. In fact, popularly, the so-called speed index is a measure of how quickly the page content is filled

After testing, it is the same as LCP, pictures and video content have a huge impact on SpeedIndex, all optimization directions , consistent with the previous one. Generally speaking, as long as the LCP and FCP time are increased, the SpeedIndex time will be significantly improved.
However, it should be noted that the speed of the interface will also affect the SpeedIndex time. Due to the popularity of AJAX Today, most of our data is pulled using interfaces. If the interface speed is too slow, it will affect the initial rendering of your page and cause performance problems. Therefore, while optimizing performance,
requesting the assistance of backend partners is also a solution for performance optimization
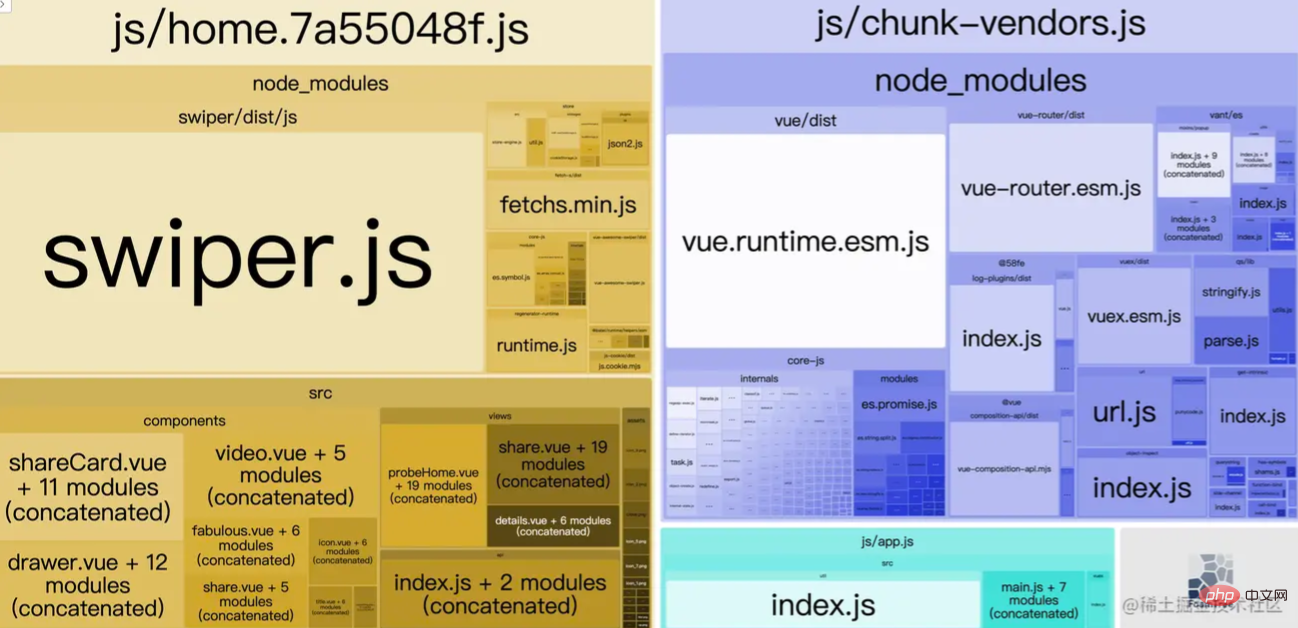
Troubleshoot performance bottlenecks The above analysis provides some conventional optimization methods based on three indicators. Among these optimization methods, you can immediately check some of them and optimize them. For example: Optimization Images, optimize font size Work with the server to utilize the browser caching mechanism. Enable cdn, enable gzip, etc. Reduce the network protocol process Consumption, reduce http requests, reduce dns queries, avoid redirects Optimize critical rendering paths, asynchronously load js, etc. But some It is not easy for us to check the optimization method because it is included in the package. What should we do if this js file contains a lot of logic? Here I have two methods that may help to find out where the performance bottleneck occurs: Analyze package content Under normal circumstances, the optimization points that we cannot judge are all after packaging. We cannot analyze that those things are not what we need on the first screen, so we cannot To make new optimizations, in order to solve current problems, major bundle manufacturers also have their own analysis package solutions Take vue-cli as an example We only need to use scaffolding By providing the above command, it can be generated during packaging. The analysis file of the entire package is shown in the figure above. After packaging, you can analyze what the packaged js file contains. Component, in this way, we can know which files do not need to be loaded synchronously, or use CDN to isolate them individually through configuration, so as to find out performance problems Use chrome The code coverage of devtool As shown in the figure below, You can use the code coverage check of devtool to know those js or css files The code has not been used. Combined with the analysis of the package content, we can roughly guess where the performance bottleneck is and perform corresponding special processing The above contents are some general optimization methods, which you can find anywhere. I just expressed the underlying reasons for doing these conventional optimizations. After you have a clearer understanding of these reasons, Then our company is Vue, we have to use Vue's method Lazy loading of images The so-called lazy loading of images means that the page only renders Pictures in the current visible area, thus reducing the number of other pictures to render, which can greatly improve the time of Introducing the image lazy loading plug-in in vue, the first recommendation: vue-lazyload https://github.com/hilongjw/vue-lazyload Easy to use, rich in functions Virtual scrolling Have you ever found a page with a long list? If you find that the more you slide down, the more stuck you get. At this time, virtual scrolling comes in handy.
Its basic principle is to only render a few pieces of data in the visible area, but simulate the effect of normal sliding. Because each time it only renders the data within the play area, its performance will be greatly improved when sliding. There are two plug-ins that are easier to use in vue: vue-virtual-scroller: https://github.com/Akryum/vue-virtual- scroller vue-virtual-scroll-list: https://github.com/tangbc/vue-virtual-scroll-list Currently our company uses vue-virtual-scroll-list. When scrolling down, you can add some loading prompts at the paging area Functional components in vue In vue, we know that the initialization of components consumes performance. You can try it. Using vue to directly render a text content, and directly rendering an app.vue component, the score is slightly higher. There are different. But when there are functional components, this problem is easily solved Because a function is a component, as the name suggests, it is a function. To put it bluntly, it is a When should you use functional components? When your components When there is no business logic and only content is displayed, functional components come in handy Use v-show and KeepAlive to reuse dom 我们知道v-show是通过display 控制dom的展示隐藏,他并不会删除dom 而我们在切换v-show的时候其实是减少了diff的对比,而KeepAlive 则是直接复用dom,连diff 的过程都没了,并且他们俩的合理使用还不会影响到初始化渲染。如此一来减少了js 的执行开销,但是值得注意的是, 分批渲染组件 在前面我们提到过SpeedIndex 的渐进渲染是提高SpeedIndex的关键,有了这个前提,我们就可以分批异步渲染组件。先看到内容,然后在渲染其他内容 举个例子: 上述例子比较简单可能描述的不太贴切,在这里特此说明一下,当前方法适用于组件内容较多,每次render 时间过长,导致白屏时间过长,比如, 性能优化一直是一个很火的话题, 不管从面试以及工作中都非常重要,有了这些优化的点,你在写代码或者优化老项目时都能游刃有余,能提前考虑到其中的一些坑,并且规避。 但是大家需要明白的是,不要为了性能优化而性能优化,我们在要 原文地址:https://juejin.cn/post/7089241058508275725 作者:好学习吧丶
"report": "vue-cli-service build --report"

Special optimization for vue
you will be able to deal with performance bottlenecks with ease, instead of memorizing them for interviews, which will not work when you use themSpeedIndex and LCP, thus improving the scorerender function, it is less It eliminates the component initialization process and saves a lot of overhead in the initialization process他并不能优化你初始化的性能,而是操作中的性能<template>
<div>
{{ data1 }}
</div>
<div v-if="data1">
{{ data2 }}
</div>
</template>
<script>
import { ref } from 'vue'
export default {
setup() {
let data1 = ref('')
let data2 = ref('')
// 假设 这是从后端取到的数据
const data = {
data1: '这是渲染内容1',
data2: '这是渲染内容2'
}
data1.value = data.data1
//利用requestAnimationFrame 在空闲的时候当前渲染之后在渲染剩余内容
requestIdleCallback(() => {
data2.value = data.data2
})
return {
data1,
data2
}
},
}
</script>一次拉取用户列表,那么分批渲染就非常合适,先展示一部分用户信息,最后直到慢慢将所有内容渲染完毕。如此对浏览器的SpeedIndex 也非常友好最后
因地制宜,在不破坏项目可维护性的基础上去优化,千万不要你优化个项目性能是好了,但是大家都看不懂了,这就有点得不偿失了,还是那句话,60分万岁61份浪费,差不多得了,把经历留着去干更重要的事情!