vueHow does the project elegantly encapsulate echarts? The following article will introduce to you a more elegant way to encapsulate echarts in the Vue project. I hope it will be helpful to you!

|-- src
    |-- components
        |-- chart
            |-- index.vue    // 图表单文件组件,供界面调用
            |-- index.js    // 实现自动化导入options里的图表option
            |-- options    // 存放各种图表的option
                |-- bar    // 随便一例子
                    |-- index.js
    |-- views
        |-- chartTest    // 实例所在
            |-- index.vue
            |-- index.scss
            |-- index.js
|-- main.js // 全局引入echarts图表Implementationcomponents--chart--index.vue
, heightheight, whether to automatically adjust the sizeautoResize (default is), chart configurationchartOption. By default, Canvas is used to render the chart. You can also use
, choose your own The specific code is as follows<div class="code" style="position:relative; padding:0px; margin:0px;"><pre class='brush:php;toolbar:false;'><template>
<div class="chart">
<div ref="chart" :style="{ height: height, width: width }" />
</div>
</template>
<script>
// 引入 echarts 核心模块,核心模块提供了 echarts 使用必须要的接口。
import * as echarts from &#39;echarts/core&#39;
// 引入柱状图图表,图表后缀都为 Chart
import {
BarChart
} from &#39;echarts/charts&#39;
// 引入提示框,标题,直角坐标系组件,组件后缀都为 Component
import {
TitleComponent,
TooltipComponent,
GridComponent
} from &#39;echarts/components&#39;
// 引入 Canvas 渲染器,注意引入 CanvasRenderer 或者 SVGRenderer 是必须的一步
import {
CanvasRenderer
} from &#39;echarts/renderers&#39;
// 注册必须的组件
echarts.use(
[TitleComponent, TooltipComponent, GridComponent, BarChart, CanvasRenderer]
)
export default {
name: &#39;ChartView&#39;,
props: {
width: {
type: String,
default: &#39;100%&#39;
},
height: {
type: String,
default: &#39;350px&#39;
},
autoResize: {
type: Boolean,
default: true
},
chartOption: {
type: Object,
required: true
},
type: {
type: String,
default: &#39;canvas&#39;
}
},
data() {
return {
chart: null
}
},
watch: {
chartOption: {
deep: true,
handler(newVal) {
this.setOptions(newVal)
}
}
},
mounted() {
this.initChart()
if (this.autoResize) {
window.addEventListener(&#39;resize&#39;, this.resizeHandler)
}
},
beforeDestroy() {
if (!this.chart) {
return
}
if (this.autoResize) {
window.removeEventListener(&#39;resize&#39;, this.resizeHandler)
}
this.chart.dispose()
this.chart = null
},
methods: {
resizeHandler() {
this.chart.resize()
},
initChart() {
this.chart = echarts.init(this.$refs.chart, &#39;&#39;, {
renderer: this.type
})
this.chart.setOption(this.chartOption)
this.chart.on(&#39;click&#39;, this.handleClick)
},
handleClick(params) {
this.$emit(&#39;click&#39;, params)
},
setOptions(option) {
this.clearChart()
this.resizeHandler()
if (this.chart) {
this.chart.setOption(option)
}
},
refresh() {
this.setOptions(this.chartOption)
},
clearChart() {
this.chart && this.chart.clear()
}
}
}
</script></pre><div class="contentsignin">Copy after login</div></div> components--chart--index.js
Here we mainly use
require.context, so there is no need to add them in the code import one by one, especially when there are many charts. <div class="code" style="position:relative; padding:0px; margin:0px;"><pre class='brush:php;toolbar:false;'>const modulesFiles = require.context(&#39;./options&#39;, true, /index.js$/)
let modules = {}
modulesFiles.keys().forEach(item => {
modules = Object.assign({}, modules, modulesFiles(item).default)
})
export default modules</pre><div class="contentsignin">Copy after login</div></div>components--chart--optionsHere is how to encapsulate the chart you want
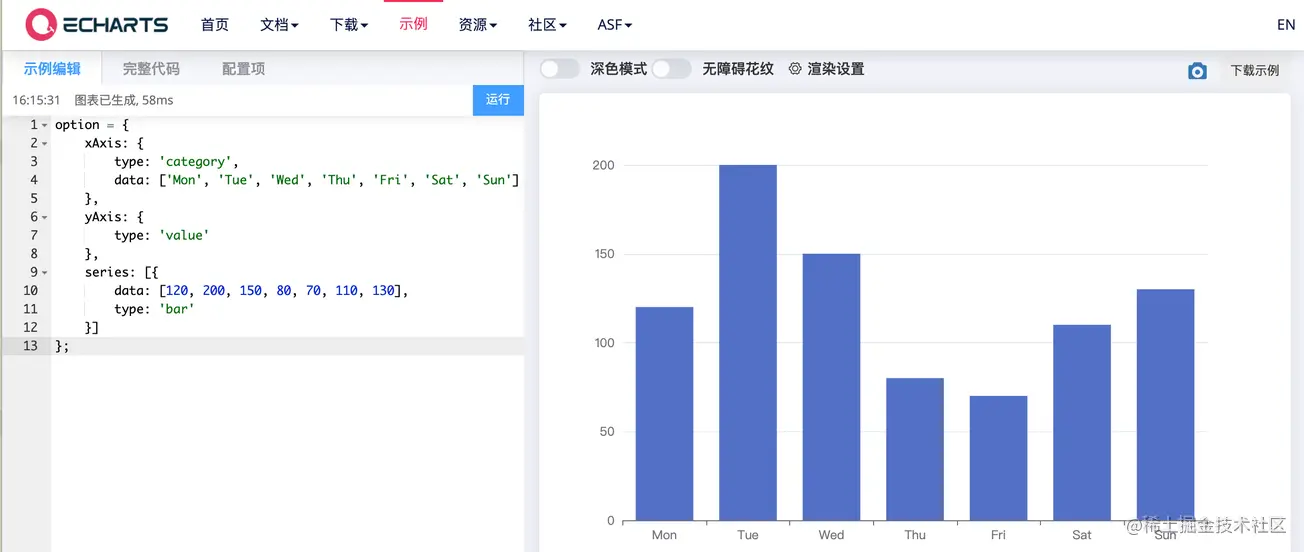
(https:/ /echarts.apache.org/examples/zh/index.html)
Create a new
under  options
directory, create a new index.js file in the bar directory. (It’s just a personal habit. I like each chart to be stored in a separate folder. If you don’t like this method, you can leave the directory and directly use the js file, but components--chart--index.js must be modified accordingly. Below) Directly copy the option code of the example
index.jsThe specific code is as follows
const testBar = (data) => {
  const defaultConfig = {
    xAxis: {
      type: 'category',
      data: ['Mon', 'Tue', 'Wed', 'Thu', 'Fri', 'Sat', 'Sun']
    },
    yAxis: {
      type: 'value'
    },
    series: [{
      data: [120, 200, 150, 80, 70, 110, 130],
      type: 'bar'
    }]
  }

  const opt = Object.assign({}, defaultConfig)
  return opt
}

export default {
  testBar
}testBarThe method can pass parameters. When used specifically, the attributes that need to be configured for the chart, such as data data, chart color, etc., can be passed as parameters.
main.jsHere, the encapsulated Echarts component is introduced globally to facilitate interface calls. (As for the method of single reference, there is no need to say more)
import eChartFn from '@/components/chart/index.js'
import ChartPanel from '@/components/chart/index.vue'
Vue.component(ChartPanel.name, ChartPanel)
Vue.prototype.$eChartFn = eChartFn
chartTest
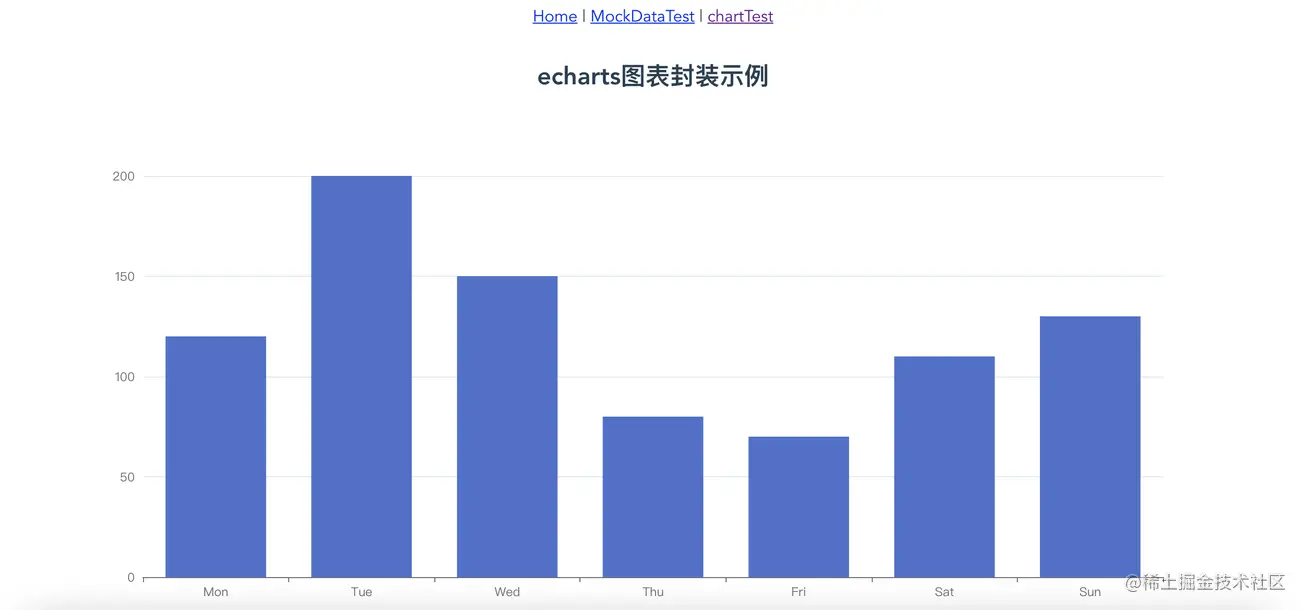
Here is how to call the encapsulated
barindex.vue<div class="code" style="position:relative; padding:0px; margin:0px;"><pre class='brush:php;toolbar:false;'><chart-view class="chart-content" :chart-option="chartOpt" :auto-resize="true" height="100%" /></pre><div class="contentsignin">Copy after login</div></div>index.js
export default {
  name: 'chartTestView',
  data() {
    return {
      chartOpt: {}
    }
  },
  mounted() {},
  created() {
    this.chartOpt = this.$eChartFn.testBar()
  },
  methods: {
  },
  watch: {}
} Code
Code
Just click the directory of
Code Overview to look for it. https://github.com/liyoro/vue-skill
Summary
, especially Echarts visual work sharing. When doing projects, you can go refer to. The above encapsulates the chart component. According to the above method, put the
option configuration and related processing of the chart under the options folder. Passing the corresponding option when calling the chart only requires a few lines of code, which is relatively convenient. chart The component is very easy to reuse and can be used directly.
评论里说想动态修改option里面的属性,稍微做了个例子,动态修改pie图表的data和color属性,这个是直接生产就可以使用的例子了,直接参考代码就行了,不详细说了。想修改什么属性,直接传参就行。传具体参数可以,想修改的属性多了就把参数封装成一个json传也可以。懂得在封装的option里面灵活使用就行。
以下是新增的参考代码
|-- src
    |-- components
        |-- chart
            |-- options    // 存放各种图表的option
                |-- pie    // pie例子
                    |-- index.js
    |-- views
        |-- chartTest    // 实例所在
            |-- index.vue
            |-- index.scss
|-- index.js代码使用都是直接一行调用的
this.chartOpt2 = this.$eChartFn.getPieChart([100, 23, 43, 65], ['#36CBCB', '#FAD337', '#F2637B', '#975FE4'])
效果如下:
效果图
加上:play-highlight="true"属性就行
<chart-view class="chart-content" :chart-option="chartOpt2" :auto-resize="true" :play-highlight="true" style="max-width:90%" />
主要实现的代码在如下文件的playHighlightAction方法里面,参考的echarts 饼图调用高亮示例 dispatchAction实现的。只是简单的高亮轮询,具体各种实现就自己看文档调样式了。
|-- src
    |-- components
        |-- chart
|-- index.js // 实现自动化导入options里的图表optionThe above is the detailed content of How does the Vue project elegantly encapsulate echarts? Method introduction. For more information, please follow other related articles on the PHP Chinese website!
 border-collapse
 What are the main differences between linux and windows
 The difference between static web pages and dynamic web pages
 Tutorial on merging multiple words into one word
 The role of c++this pointer
 How to close port 445 in xp
 How to install pycharm
 How to open Windows 7 Explorer
 Google earth cannot connect to the server solution