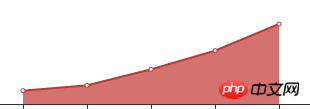
This is my chart data
I want the red part to be a gradient color.
I have used the visvisualMap method, but it cannot achieve the effect I want.
When I use new echarts.graphic.LinearGradient(0, 0, 0, 1, [{
                    offset: 0,
                    color: 'rgb(255, 158, 68)'
                }, {
                    offset: 1,
                    color: 'rgb(255, 70, 131)'
                }])。。。我找到的其中一种方法,。。但是不知道怎么获取echarts对象,
Since we don’t want to introduce too many resources into the project, introducing zRender is not considered for the time being. . .
Help
I hope to solve the problem of using vue-echarts-v3 plug-in and get new echarts.graphic.LinearGradient()
<IEcharts :option="bar" class="step_echarts"></IEcharts
import IEcharts from 'vue-echarts-v3'
import 'echarts/lib/chart/line'
export defalut{
data(){
return{
    bar: {
            tooltip: {},
            xAxis: {
                data: ['1泡', '2泡', '3泡', '4泡', '5泡'],
                axisTick:{
                    alignWithLabel:true
                }
            },
            yAxis: {
                show:false
            },
            series: [{
                name: 'Clouds',
                type: 'line',
                data: [5, 7, 13, 20, 30],
                areaStyle: {normal:{}}
            }]
        }
    }
}
}
}
I randomly wrote three colors.
What the person above said is right, if you want a gradient, you have to set a legend for it and tell it where to gradient from, otherwise the default color will be used