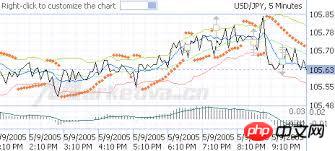
I want to display the data obtained from the API as a real-time trend chart, as shown below
I have only used matplotlib.pyplot to make graphs. matplotlib.pyplot seems to be static. Is there any dynamic or real-time version? Thanks
人生最曼妙的风景,竟是内心的淡定与从容!
matplotlib can draw dynamically updated graphs. The principle is to obtain corresponding data from the API regularly and continuously draw graphs
Related codes can be searched: matplotlib dynamic update
Use interactive modules such as plotly


![[Web front-end] Node.js quick start](https://img.php.cn/upload/course/000/000/067/662b5d34ba7c0227.png)


matplotlib can draw dynamically updated graphs. The principle is to obtain corresponding data from the API regularly and continuously draw graphs
Related codes can be searched: matplotlib dynamic update
Use interactive modules such as plotly