
The data format is as follows:
[
  {
    "event": {
      "id": "2013",
      "startTime": "00:57:00",
      "endTime": "07:56:00",
      "title": "list 1",
      "backgroundColor": "#f6c79f",
      "textColor": "#8c725b",
      "order": 2014
    }
  },
  {
    "event": {
      "id": "2016",
      "startTime": "00:51:59",
      "endTime": "06:57:00",
      "title": "list 2",
      "backgroundColor": "#a7bff7",
      "textColor": "#5f6d8c",
      "order": 2017
    }
  },
  {
    "event": {
      "id": "2019",
      "startTime": "00:11:00",
      "endTime": "11:35:00",
      "title": "list 3",
      "backgroundColor": "#beea91",
      "textColor": "#728c57",
      "order": 2020
    }
  },
  {
    "event": {
      "id": "2022",
      "startTime": "09:01:00",
      "endTime": "13:18:00",
      "title": "list 4",
      "backgroundColor": "#d1b1ff",
      "textColor": "#73618c",
      "order": 2023
    }
  }
]
Description of requirements:
Plot each data on a 1-day coordinate map (00:00 - 24:00),
The possible schematic diagram is as follows:
1. According to the startTime and endTime of the data, the coordinates of the data on the Y axis can be obtained ( is represented by the top and height values, which has been implemented)
2. Since each time period may intersect (part of the time period (startTime - endTime) of one event is in the time period of another event, it is called intersection), then the intersection on the X axis The width of the event bisects the If they intersect and divide equally, the larger the order must be, the higher the position 2.3 An event may intersect with another event, or may intersect with several other events
My question is how to implement the algorithm of bisecting the width of the X-axis and positioning the left? That is, the left and width of each element are worth the algorithm


![[Web front-end] Node.js quick start](https://img.php.cn/upload/course/000/000/067/662b5d34ba7c0227.png)


Written roughly, the basic idea is
First sort all tasks from large to small (this part is omitted)
Press start end to generate a task object, and use add_one of the figure object to add it to the figure in turn.
When inserting an object, determine the overlapping objects among the existing objects, make its left equal to the left+1 of the largest overlapping object, and update the maximum width at the same time
Finally, use the is_overlap method to detect events in tasks that do not intersect with any events, and mark them. The left of these events is set to 0, and the width is set to 100%. For events other than these events, the width is set to 1/max_width, left Set to 1/max_width*(left-1) (this part is omitted)
The following code is steps 2 and 3
2D Grouping
-
In this way, after grouping the two dimensions vertically and horizontally, it is straightforward to convert them into graphics.Group vertically first (
VGroups). Events that have intersecting relationships are grouped into the same group. Each group is independent (the groups do not intersect). The grouping algorithm is: treat each event as a node, and if two nodes intersect, an edge is connected. In this way, a graph is obtained, and grouping is to find the connected components of this graph. You can use algorithms such as depth-first search or breadth-first search to find connected components.Group horizontally within vertical groups (
HGroups). Events that have no intersection relationship between them are grouped into the same group (the groups do not intersect). The purpose of this step is to compress the number of events that can be displayed side by side and utilize unoccupied space.
Test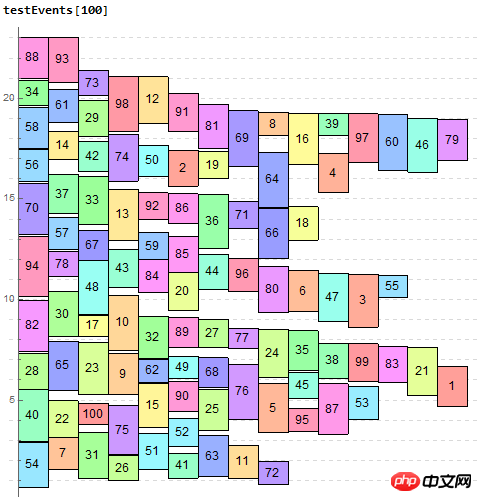
Attached:Mahematica code
@saigyouyou
It might be like this