
1. Column charts are stacked, and each data has an image annotation, but I don’t understand the positioning and display. Just used echarts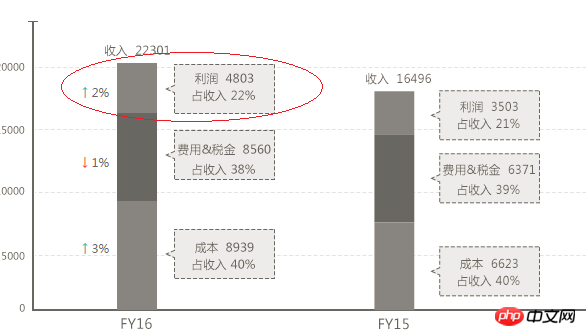
2. Each series.data in the red circle must display a detail frame. Can only markpoint be used? Is this requirement achieved? How to locate? .....help....


![[Web front-end] Node.js quick start](https://img.php.cn/upload/course/000/000/067/662b5d34ba7c0227.png)


Look at the document carefully and you’ll find it
Don’t use Baidu’s crap, use highchart.