
import turtle


def main():
    #设置窗口信息
    turtle.title('数据驱动的动态路径绘制')
    turtle.setup(800, 600, 0, 0) # 坐标原点在中心

    #设置画笔
    pen = turtle.Turtle()
    pen.color('red')
    pen.width(4)
    pen.shape('turtle')
    pen.speed(5)

    #读取文件
    result = [] #定义一个空列表
    file = open('data.txt', 'r')
    for line in file:
        result.append(list(map(float, line.split(','))))   # map()将其他类型的数转换成list
        # list(map(float, line.split(','))) 将float作用于line.split(',')每一项,并生成一个list
        print(result)

    # 动态绘制
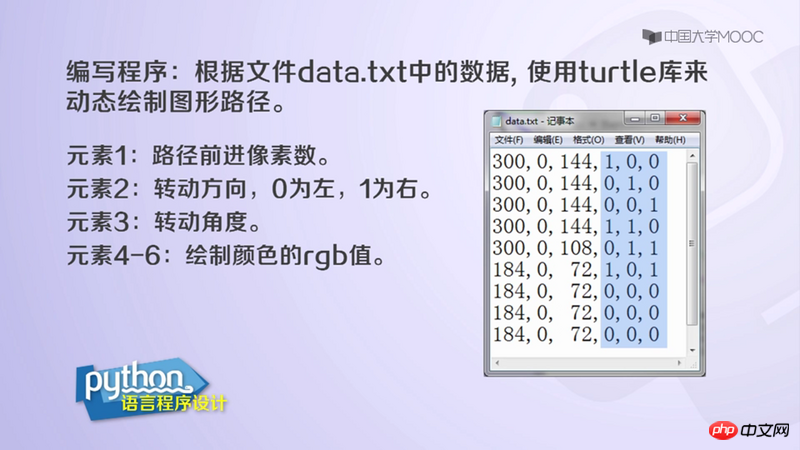
    # 300(forward 300px), 0(0:left; 1:right), 144(angle), 1, 0, 0 (rgb)
    for i in range(len(result)):
        pen.color(result[i][3], result[i][4], result[i][5])
        pen.forward(result[i][0])
        if result[i][1]:
            pen.rt(result[i][2]) # rt : right
        else:
            pen.lt(result[i][2]) # lt : left
    pen.goto(0, 0) #将画笔定位于窗口的原点

if __name__ == '__main__':
    main()
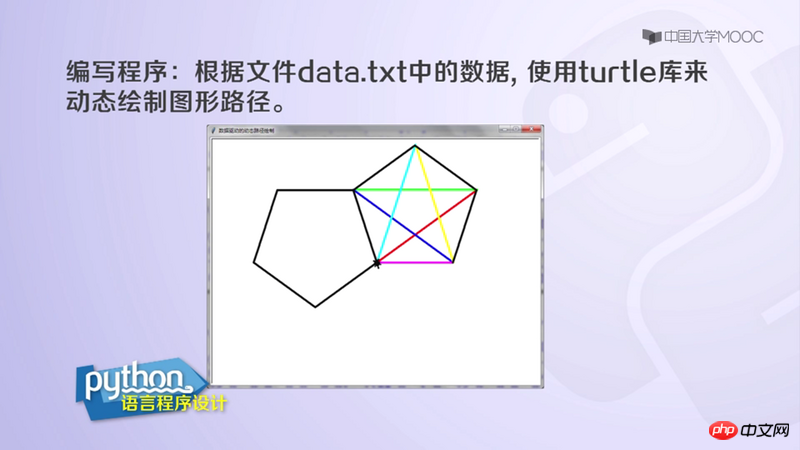
Shouldn’t the value of len(result) be 9? Why does the drawn picture have several more strokes than the loop?
Because the data.txt on the right side of the first PPT you see is incomplete, and there are still a few lines that are not displayed. You have to drag the scroll bar down to see it all