javascript - Google Chrome cannot debug breakpoints
天蓬老师2017-06-12 09:30:23
0
5
1165
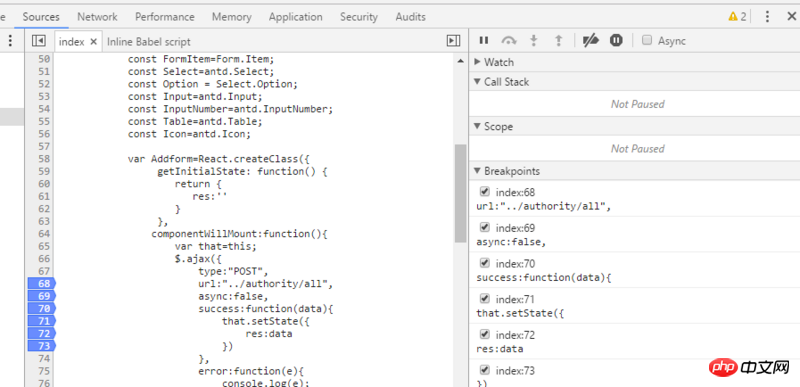
As shown in the figure, refreshing the page after setting a breakpoint does not allow debugger to be entered. It was possible before and the settings were not changed. Any solution?
Faced with such a problem, we don’t necessarily have to worry about why this debugging doesn’t work. We can use other methods to check and debug our own code. 1. Here we can use the Network to check whether an asynchronous request has been initiated, whether the request is successful, and whether the response is normal. 2. Check through the console to see if there is any code error, and then try to print the output through console.log, 3. Eliminate possible problems one by one. The breakpoint debugging method of js is sometimes time-consuming and laborious. The fact that you did not enter the breakpoint may be more related to ajax. It seems to be caused by the delay in the ajax request. You can test this. .
There is no specific answer to your question here, I'm sorry, but when I see this problem, I also want to provide a solution, I hope it can help you.
Add three breakpoints to determine 1. Add a breakpoint to var that=this to determine whether the function is called 2. Add a breakpoint to success to determine whether it is OK 3. Add a breakpoint to error to determine whether Failed


![[Web front-end] Node.js quick start](https://img.php.cn/upload/course/000/000/067/662b5d34ba7c0227.png)


Maybe this code is not running
Is this printed? If it is printed, it means that there is an exception in this ajax request, and it will not enter the success callback
Faced with such a problem, we don’t necessarily have to worry about why this debugging doesn’t work. We can use other methods to check and debug our own code.
1. Here we can use the Network to check whether an asynchronous request has been initiated, whether the request is successful, and whether the response is normal.
2. Check through the console to see if there is any code error, and then try to print the output through console.log,
3. Eliminate possible problems one by one. The breakpoint debugging method of js is sometimes time-consuming and laborious. The fact that you did not enter the breakpoint may be more related to ajax. It seems to be caused by the delay in the ajax request. You can test this. .
There is no specific answer to your question here, I'm sorry, but when I see this problem, I also want to provide a solution, I hope it can help you.
Add three breakpoints to determine
1. Add a breakpoint to var that=this to determine whether the function is called
2. Add a breakpoint to success to determine whether it is OK
3. Add a breakpoint to error to determine whether Failed
The method is not entered yet