option = {
    title: {
        text: '堆叠区域图'
    },
    tooltip : {
        trigger: 'axis',
        axisPointer: {
            type: 'cross',
            label: {
                backgroundColor: '#6a7985'
            }
        }
    },
    legend: {
        data:['联盟广告']
    },
    toolbox: {
        feature: {
            saveAsImage: {}
        }
    },
    grid: {
        left: '3%',
        right: '4%',
        bottom: '3%',
        containLabel: true
    },
    xAxis : [
        {
            type : 'category',
            boundaryGap : false,
            data : ['周一','周二','周三','周四','周五','周六','周日']
        }
    ],
    yAxis : [
        {
            type : 'value'
        }
    ],
    series : [
        {
            name:'联盟广告',
            type:'line',
            stack: '总量',
            areaStyle: {normal: {}},
            data:[220, 220.1, 220.2, 220.2, 220.3, 220.4, 310]
        },

    ]
};
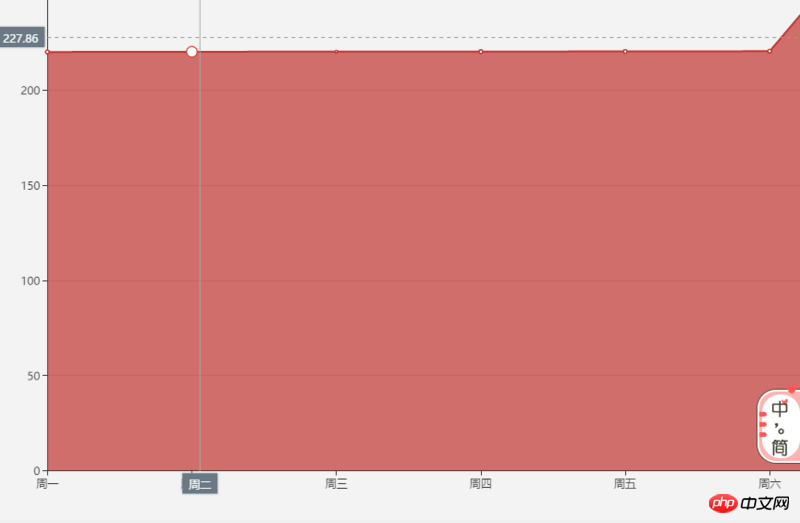
The difference in quantity is all after the decimal point. Basically, there is no difference in this picture. Which parameter can be controlled to amplify this difference

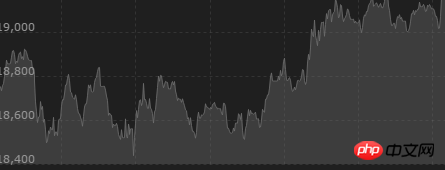
Make it similar to this one with a relatively large gap

Thank you
Find the minimum value of the data and set the y-axis minimum value to the minimum value of your data