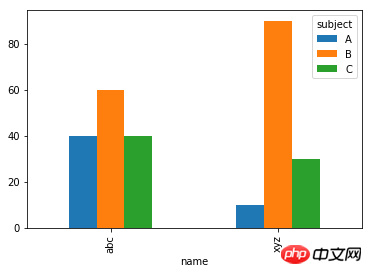
How to draw a bar chart with the name as the abscissa and the score as the ordinate?
Try it
df.pivot('name', 'subject', 'score').plot.bar()
The basic pandas visualization principle is to use pivot or melt to create the table format required for charting.
The following is the code I ran (Jupyter Notebook)
% matplotlib inline
data = [ {"name":"abc", "subject":"A", "score":40}, {"name":"abc", "subject":"B", "score":60}, {"name":"abc", "subject":"C", "score":40},
        {"name":"xyz", "subject":"A", "score":10}, {"name":"xyz", "subject":"B", "score":90}, {"name":"xyz", "subject":"C", "score":30}]
df = pd.DataFrame(data)
df.pivot('name', 'subject', 'score').plot.bar()
Result:
Try it
The basic pandas visualization principle is to use pivot or melt to create the table format required for charting.
The following is the code I ran (Jupyter Notebook)
Result:
