image description


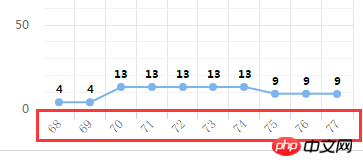
The above chart adds data dynamically. The variable xdata in the code is a time, and the format is 17:21:11. It can be printed out, and the y-axis can also be printed normally. But now the Y-axis data can be rendered normally, but the x-axis cannot be displayed. The expected effect should be to display the time, but now the accumulated numbers starting from 1 are displayed.
You first try setting the type of xAxis to
in the options passed to the highcharts constructorcategory;