
下面这个图是别人使用java画的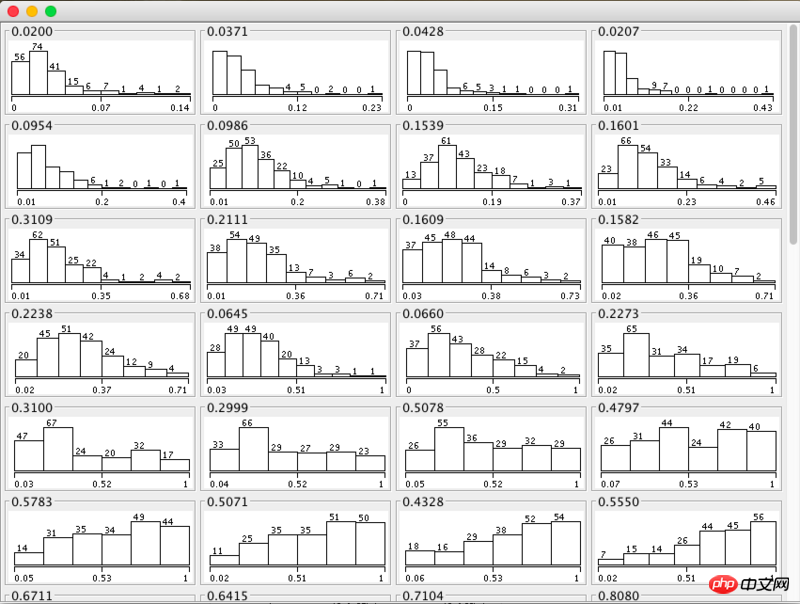
下面这个图是我自己用matplotlib画的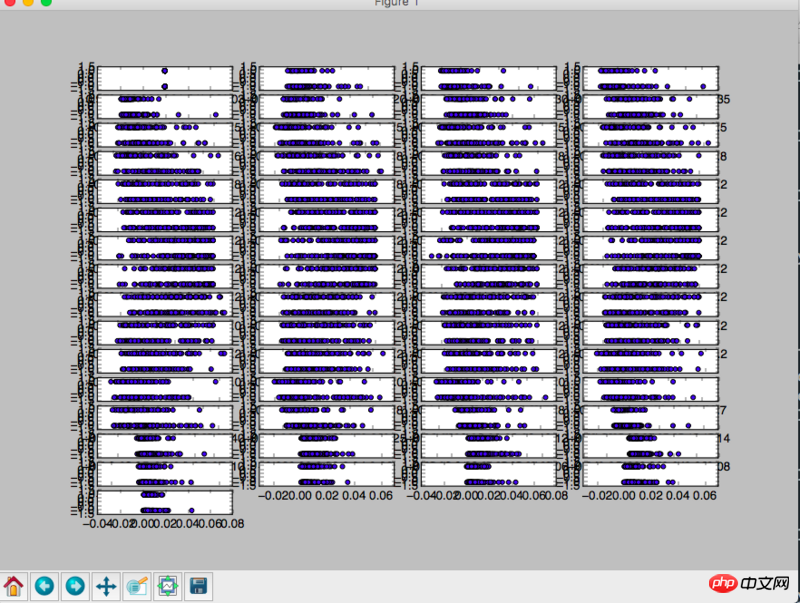
代码是这个样子的
import utils
import matplotlib.pyplot as plt
import numpy as np
from scipy.stats import pearsonr


X, y = utils.load_data('./sonar.data.csv', ',')
X = np.array(X)
y = np.array(y)


f1 = plt.figure()
for i in xrange(len(X[0])):
    plt.subplot(16, 4, i+1)
    plt.scatter(X[:,i], y)
    pea = pearsonr(X[:,i], y)[0]
plt.show()
问题就是图都挤在一起了, 而且调整窗口大小的时候,会有很大的延迟。
求问怎么解决这两个问题???


![[Web front-end] Node.js quick start](https://img.php.cn/upload/course/000/000/067/662b5d34ba7c0227.png)


You can let matplotlib adjust the position of the subplot through plt.tight_layout():
http://matplotlib.org/users/t...
The simplest columnar code should be like this