

使用10046查看执行计划并读懂trace文件

查看 sql 执行计划的方法有许多种, 10046 事件就是其中的一种. 与其他查看 sql 执行计划不同, 当我们遇到比较复杂的 sql 语句, 我们可以通过 10046 跟踪 sql 得到执行计划中每一个步骤的逻辑读, 物理读以及花费的时间等. 这种细粒度的跟踪对于我们分析 sql 性
查看 sql 执行计划的方法有许多种, 10046 事件就是其中的一种. 与其他查看 sql 执行计划不同, 当我们遇到比较复杂的 sql 语句, 我们可以通过 10046 跟踪 sql 得到执行计划中每一个步骤的逻辑读, 物理读以及花费的时间等. 这种细粒度的跟踪对于我们分析 sql 性能尤其有用.一般来说, 使用 10046 事件得到 sql 执行计划的步骤如下:
1. 激活当前 session 10046 事件
2. 在当前 session 中执行 sql 语句
3. 关闭当前 session 10046 事件
执行完上述步骤后, 通常会自动生成一个 trace 文件. 在 oracle 11g 中, trace 文件一般放在$ORACLE_BASE/diag/rdbms/{database_name}/$ORACLE_SID/trace 目录下. 如果使用 oradebug 激活跟踪 10046后, 可以使用 oradebug tracefile_name 得到刚刚生成的 trace 文件的完整路径.
NAME                                 TYPE        VALUE
------------------------------------ ----------- ------------------------------
background_dump_dest                 string      g:\app\davidd\diag\rdbms\david
\david\trace刚刚提到的 oradebug 激活跟踪 10046 事件, 我想大部分 dba 都会使用. oradebug 是个功能强大非常好用的工具, 使用 oradebug help 将会看到它的功能很多
SQL> oradebug help HELP [command] Describe one or all commands SETMYPID Debug current process SETOSPID <ospid> Set OS pid of process to debug SETORAPID <orapid> ['force'] Set Oracle pid of process to debug SETORAPNAME <orapname> Set Oracle process name to debug SHORT_STACK Get abridged OS stack CURRENT_SQL Get current SQL DUMP <dump_name> <lvl> [addr] Invoke named dump DUMPSGA [bytes] Dump fixed SGA DUMPLIST Print a list of available dumps EVENT <text> Set trace event in process SESSION_EVENT <text> Set trace event in session DUMPVAR <p|s|uga> <name> [level] Print/dump a fixed PGA/SGA/UGA variable DUMPTYPE <address> <type> <count> Print/dump an address with type info SETVAR <p|s|uga> <name> <value> Modify a fixed PGA/SGA/UGA variable PEEK <addr> <len> [level] Print/Dump memory POKE <addr> <len> <value> Modify memory WAKEUP <orapid> Wake up Oracle process SUSPEND Suspend execution RESUME Resume execution FLUSH Flush pending writes to trace file CLOSE_TRACE Close trace file TRACEFILE_NAME Get name of trace file LKDEBUG Invoke global enqueue service debugger NSDBX Invoke CGS name-service debugger -G <Inst-List | def | all> Parallel oradebug command prefix -R <Inst-List | def | all> Parallel oradebug prefix (return output SETINST <instance# .. | all> Set instance list in double quotes SGATOFILE <SGA dump dir> Dump SGA to file; dirname in double quotes DMPCOWSGA <SGA dump dir> Dump & map SGA as COW; dirname in double quotes MAPCOWSGA <SGA dump dir> Map SGA as COW; dirname in double quotes HANGANALYZE [level] [syslevel] Analyze system hang FFBEGIN Flash Freeze the Instance FFDEREGISTER FF deregister instance from cluster FFTERMINST Call exit and terminate instance FFRESUMEINST Resume the flash frozen instance FFSTATUS Flash freeze status of instance SKDSTTPCS <ifname> <ofname> Helps translate PCs to names WATCH <address> <len> <self|exist|all|target> Watch a region of memory DELETE <local|global|target> watchpoint <id> Delete a watchpoint SHOW <local|global|target> watchpoints Show watchpoints DIRECT_ACCESS <set/enable/disable command | select query> Fixed table access CORE Dump core without crashing process IPC Dump ipc information UNLIMIT Unlimit the size of the trace file PROCSTAT Dump process statistics CALL <func> [arg1] ... [argn] Invoke function with arguments
SQL> oradebug setmypid
Statement processed.

// 激活 10046 事件
SQL> oradebug event 10046 trace name context forever,level 12;
Statement processed.

SQL> select /*+ leading(t3) use_merge(t4) */ *
  2  from t3, t4
  3  where t3.id = t4.t3_id and t3.n = 1100;

10 rows selected.

// 在当前 session 关闭 10046 事件
SQL> oradebug event 10046 trace name context off;
Statement processed.

// 使用 oradebug tracefile_name 可以直接看到生成的 trace 文件的位置
SQL> oradebug tracefile_name;
g:\app\davidd\diag\rdbms\david\david\trace\david_ora_2176.trc
其中, 10046 按照收集信息的内容分为以下等级:
| Level 0 | 停用SQL跟踪,相当于SQL_TRACE=FALSE |
| Level 1 | 标准SQL跟踪,相当于SQL_TRACE=TRUE |
| Level 4 | 在level 1的基础上增加绑定变量的信息 |
| Level 8 | 在level 1的基础上增加等待事件的信息 |
| Level 12 | 在level 1的基础上增加绑定变量和等待事件的信息 |
分析读懂 trace 文件
现在我们打开 g:\app\davidd\diag\rdbms\david\david\trace\david_ora_2176.trc 看看生成的 trace 文件的内容
<pre name="code" class="sql"><pre name="code" class="sql"><pre name="code" class="sql"><pre name="code" class="sql" style="font-size:14px;">PARSING IN CURSOR #22 len=92 dep=0 uid=0 oct=3 lid=0 tim=900460923321 hv=1624778336 ad='34671d90' sqlid='g0rdyg9hdh9m0' select /*+ leading(t3) use_merge(t4) */ * from t3, t4 where t3.id = t4.t3_id and t3.n = 1100 END OF STMT PARSE #22:c=0,e=10777,p=0,cr=0,cu=0,mis=1,r=0,dep=0,og=1,plh=3831111046,tim=900460923319 EXEC #22:c=0,e=29,p=0,cr=0,cu=0,mis=0,r=0,dep=0,og=1,plh=3831111046,tim=900460923482 WAIT #22: nam='SQL*Net message to client' ela= 2 driver id=1111838976 #bytes=1 p3=0 obj#=-1 tim=900460923512 FETCH #22:c=15625,e=23922,p=0,cr=119,cu=0,mis=0,r=1,dep=0,og=1,plh=3831111046,tim=900460947462 WAIT #22: nam='SQL*Net message from client' ela= 221 driver id=1111838976 #bytes=1 p3=0 obj#=-1 tim=900460947755 WAIT #22: nam='SQL*Net message to client' ela= 2 driver id=1111838976 #bytes=1 p3=0 obj#=-1 tim=900460947803 FETCH #22:c=0,e=71,p=0,cr=0,cu=0,mis=0,r=9,dep=0,og=1,plh=3831111046,tim=900460947864 STAT #22 id=1 cnt=10 pid=0 pos=1 obj=0 op='MERGE JOIN (cr=119 pr=0 pw=0 time=28 us cost=193 size=1280 card=10)' STAT #22 id=2 cnt=1 pid=1 pos=1 obj=0 op='SORT JOIN (cr=15 pr=0 pw=0 time=0 us cost=6 size=63 card=1)' STAT #22 id=3 cnt=1 pid=2 pos=1 obj=83550 op='TABLE ACCESS FULL T3 (cr=15 pr=0 pw=0 time=0 us cost=5 size=63 card=1)' STAT #22 id=4 cnt=10 pid=1 pos=2 obj=0 op='SORT JOIN (cr=104 pr=0 pw=0 time=11 us cost=187 size=650000 card=10000)' STAT #22 id=5 cnt=10000 pid=4 pos=1 obj=83552 op='TABLE ACCESS FULL T4 (cr=104 pr=0 pw=0 time=8603 us cost=29 size=650000 card=10000)'
从上面的 trace 文件我们可以看出 sql 语句经过了 parse(解析) -> exec(执行) -> fetch(从游标中获取数据) 几个过程, 其中第一句说明了当前跟踪执行的 sql 语句的概况,比如使用游标号, sql 语句的长度, 递归深度等等基本信息:
PARSING IN CURSOR #22 len=92 dep=0 uid=0 oct=3 lid=0 tim=900460923321 hv=1624778336 ad='34671d90' sqlid='g0rdyg9hdh9m0'
| cursor | cursor number |
| len | sql 语句长度 |
| dep | sql 语句递归深度 |
| uid | user id |
| oct | oracle command type |
| lid | privilege user id |
| tim | timestamp,时间戳 |
| hv | hash id |
| ad | sql address 地址, 用在 v$sqltext |
| sqlid | sql id |
接着, 下面的语句说明了 sql 语句具体的执行过程以及每一个步骤消耗 CPU 的时间等性能指标
PARSE #22:c=0,e=10777,p=0,cr=0,cu=0,mis=1,r=0,dep=0,og=1,plh=3831111046,tim=900460923319
EXEC #22:c=0,e=29,p=0,cr=0,cu=0,mis=0,r=0,dep=0,og=1,plh=3831111046,tim=900460923482
FETCH #22:c=15625,e=23922,p=0,cr=119,cu=0,mis=0,r=1,dep=0,og=1,plh=3831111046,tim=900460947462
| c | CPU 消耗的时间 |
| e | Elapsed time |
| p | number of physical reads 物理读的次数 |
| cr | number of buffers retrieved for CR reads 逻辑读的数据块 |
| cu | number of buffers retrieved in current mode (current 模式读取的数据块) |
| mis | cursor missed in the cache 库缓存中丢失的游标, 硬解析次数 |
| r | number of rows processed 处理的行数 |
| dep | 递归深度 |
| og | optimizer mode 【1:all_rows, 2:first_rows, 3:rule, 4:choose】 |
| plh | plan hash value |
| tim | timestamp 时间戳 |
以及执行过程中的发生的等待事件
WAIT #22: nam='SQL*Net message to client' ela= 2 driver id=1111838976 #bytes=1 p3=0 obj#=-1 tim=900460923512
| nam | an event that we waited for 等待事件 |
| ela | 此操作消耗的时间 |
| p3 | block 块号 |
| trm | timestamp 时间戳 |
最后显示的是该游标的执行计划
STAT #22 id=1 cnt=10 pid=0 pos=1 obj=0 op='MERGE JOIN  (cr=119 pr=0 pw=0 time=28 us cost=193 size=1280 card=10)'
STAT #22 id=2 cnt=1 pid=1 pos=1 obj=0 op='SORT JOIN (cr=15 pr=0 pw=0 time=0 us cost=6 size=63 card=1)'
STAT #22 id=3 cnt=1 pid=2 pos=1 obj=83550 op='TABLE ACCESS FULL T3 (cr=15 pr=0 pw=0 time=0 us cost=5 size=63 card=1)'
STAT #22 id=4 cnt=10 pid=1 pos=2 obj=0 op='SORT JOIN (cr=104 pr=0 pw=0 time=11 us cost=187 size=650000 card=10000)'
STAT #22 id=5 cnt=10000 pid=4 pos=1 obj=83552 op='TABLE ACCESS FULL T4 (cr=104 pr=0 pw=0 time=8603 us cost=29 size=650000 card=10000
| cnt | 当前行源返回的行数 |
| pid | parent id of this row source 当前行源的父结点 id |
| pos | position in explain plan 执行计划的位置 |
| obj | object id of row source (if this is a base object) |
| op | the row source access operation |
例如, 执行步骤 merge join 消耗的逻辑读为 119, 物理读为 0, 耗费的时间为 28 us, 成本 cost 193,返回 10 条记录
使用 tkprof 命令翻译 trace 文件
我们也可以使用 tkprof 命令对 trace 文件进行翻译,得到一个容易理解的 trace 汇总报表文件
C:\Documents and Settings\davidd> tkprof g:\app\davidd\diag\rdbms\david\david\trace\david_ora_2176.trc d:\trace.trc

TKPROF: Release 11.2.0.1.0 - Development on Thu Dec 18 18:51:44 2014

Copyright (c) 1982, 2009, Oracle and/or its affiliates.  All rights reserved.
tkprof 翻译的 trace 文件的汇总报表如下:
Trace file: g:\app\davidd\diag\rdbms\david\david\trace\david_ora_2176.trc
Sort options: default


********************************************************************************
count    = number of times OCI procedure was executed
cpu      = cpu time in seconds executing
elapsed  = elapsed time in seconds executing
disk     = number of physical reads of buffers from disk
query    = number of buffers gotten for consistent read
current  = number of buffers gotten in current mode (usually for update)
rows     = number of rows processed by the fetch or execute call
********************************************************************************


select /*+ leading(t3) use_merge(t4) */ *
from t3, t4
where t3.id = t4.t3_id and t3.n = 1100


call     count       cpu    elapsed       disk      query    current        rows
------- ------  -------- ---------- ---------- ---------- ----------  ----------
Parse        1      0.00       0.00          0          0          0           0
Execute      1      0.00       0.00          0          0          0           0
Fetch        2      0.00       0.00          0        119          0          10
------- ------  -------- ---------- ---------- ---------- ----------  ----------
total        4      0.00       0.00          0        119          0          10


Misses in library cache during parse: 1
Optimizer mode: ALL_ROWS
Parsing user id: SYS


Rows     Row Source Operation
-------  ---------------------------------------------------
     10  MERGE JOIN  (cr=119 pr=0 pw=0 time=0 us cost=193 size=1280 card=10)
      1   SORT JOIN (cr=15 pr=0 pw=0 time=0 us cost=6 size=63 card=1)
      1    TABLE ACCESS FULL T3 (cr=15 pr=0 pw=0 time=0 us cost=5 size=63 card=1)
     10   SORT JOIN (cr=104 pr=0 pw=0 time=0 us cost=187 size=650000 card=10000)
  10000    TABLE ACCESS FULL T4 (cr=104 pr=0 pw=0 time=8733 us cost=29 size=650000 card=10000)


Elapsed times include waiting on following events:
  Event waited on                             Times   Max. Wait  Total Waited
  ----------------------------------------   Waited  ----------  ------------
  SQL*Net message to client                       2        0.00          0.00
  SQL*Net message from client                     2       20.23         20.23


********************************************************************************


OVERALL TOTALS FOR ALL NON-RECURSIVE STATEMENTS


call     count       cpu    elapsed       disk      query    current        rows
------- ------  -------- ---------- ---------- ---------- ----------  ----------
Parse        1      0.00       0.00          0          0          0           0
Execute      1      0.00       0.00          0          0          0           0
Fetch        2      0.00       0.00          0        119          0          10
------- ------  -------- ---------- ---------- ---------- ----------  ----------
total        4      0.00       0.00          0        119          0          10


Misses in library cache during parse: 1


Elapsed times include waiting on following events:
  Event waited on                             Times   Max. Wait  Total Waited
  ----------------------------------------   Waited  ----------  ------------
  SQL*Net message to client                       3        0.00          0.00
  SQL*Net message from client                     3       20.23         30.20


OVERALL TOTALS FOR ALL RECURSIVE STATEMENTS


call     count       cpu    elapsed       disk      query    current        rows
------- ------  -------- ---------- ---------- ---------- ----------  ----------
Parse        0      0.00       0.00          0          0          0           0
Execute      0      0.00       0.00          0          0          0           0
Fetch        0      0.00       0.00          0          0          0           0
------- ------  -------- ---------- ---------- ---------- ----------  ----------
total        0      0.00       0.00          0          0          0           0


Misses in library cache during parse: 0


    1  user  SQL statements in session.
    0  internal SQL statements in session.
    1  SQL statements in session.
********************************************************************************
Trace file: g:\app\davidd\diag\rdbms\david\david\trace\david_ora_2176.trc
Trace file compatibility: 11.1.0.7
Sort options: default


       1  session in tracefile.
       1  user  SQL statements in trace file.
       0  internal SQL statements in trace file.
       1  SQL statements in trace file.
       1  unique SQL statements in trace file.
     122  lines in trace file.
0 elapsed seconds in trace file.其中,Misses in library cache during parse :1 意思是解析的时候库缓存丢失游标, 也就是说发生了一次硬解析

熱AI工具

Undresser.AI Undress
人工智慧驅動的應用程序,用於創建逼真的裸體照片

AI Clothes Remover
用於從照片中去除衣服的線上人工智慧工具。

Undress AI Tool
免費脫衣圖片

Clothoff.io
AI脫衣器

AI Hentai Generator
免費產生 AI 無盡。

熱門文章
熱工具

記事本++7.3.1
好用且免費的程式碼編輯器

SublimeText3漢化版
中文版,非常好用

禪工作室 13.0.1
強大的PHP整合開發環境

Dreamweaver CS6
視覺化網頁開發工具

SublimeText3 Mac版
神級程式碼編輯軟體(SublimeText3)
熱門話題


 出現0x80004005錯誤代碼怎麼辦 小編教你0x80004005錯誤代碼解決方法
Mar 21, 2024 pm 09:17 PM
出現0x80004005錯誤代碼怎麼辦 小編教你0x80004005錯誤代碼解決方法
Mar 21, 2024 pm 09:17 PM
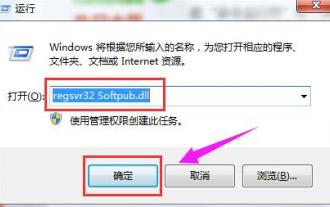
在電腦中刪除或解壓縮資料夾,時有時會彈出提示對話框“錯誤0x80004005:未指定錯誤”,如果遇到這中情況應該怎麼解決呢?提示錯誤碼0x80004005的原因其實很多,但大部分因為病毒導致,我們可以重新註冊dll來解決問題,下面,小編給大夥講解0x80004005錯誤代碼處理經驗。有使用者在使用電腦時出現錯誤代碼0X80004005的提示,0x80004005錯誤主要是由於電腦沒有正確註冊某些動態連結庫文件,或電腦與Internet之間存在不允許的HTTPS連接防火牆所引起。那麼如何
 網易信箱大師怎麼用
Mar 27, 2024 pm 05:32 PM
網易信箱大師怎麼用
Mar 27, 2024 pm 05:32 PM
網易郵箱,作為中國網友廣泛使用的一種電子郵箱,一直以來以其穩定、高效的服務贏得了用戶的信賴。而網易信箱大師,則是專為手機使用者打造的信箱軟體,它大大簡化了郵件的收發流程,讓我們的郵件處理變得更加便利。那麼網易信箱大師該如何使用,具體又有哪些功能呢,下文中本站小編將為大家帶來詳細的內容介紹,希望能幫助到大家!首先,您可以在手機應用程式商店搜尋並下載網易信箱大師應用程式。在應用寶或百度手機助手中搜尋“網易郵箱大師”,然後按照提示進行安裝即可。下載安裝完成後,我們打開網易郵箱帳號並進行登錄,登入介面如下圖所示
 抖音查看刪除登入裝置的操作步驟
Mar 26, 2024 am 09:01 AM
抖音查看刪除登入裝置的操作步驟
Mar 26, 2024 am 09:01 AM
1.先點選開啟抖音app,點選【我】。 2.點選右上方三點的圖示。 3.點選進入【設定】。 4.點選開啟【帳號與安全】。 5.選擇點選【登入設備管理】。 6.最後點選選擇其中的設備,點選【移除】即可。
 百度網盤app怎麼用
Mar 27, 2024 pm 06:46 PM
百度網盤app怎麼用
Mar 27, 2024 pm 06:46 PM
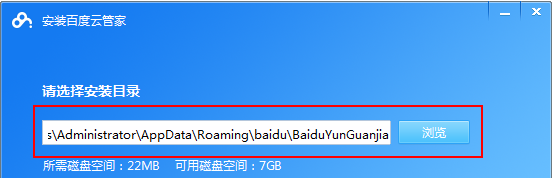
在如今雲端儲存已成為我們日常生活和工作中不可或缺的一部分。百度網盤作為國內領先的雲端儲存服務之一,憑藉其強大的儲存功能、高效的傳輸速度以及便捷的操作體驗,贏得了廣大用戶的青睞。而且無論你是想要備份重要文件、分享資料,還是在線上觀看影片、聽取音樂,百度網盤都能滿足你的需求。但很多用戶可能對百度網盤app的具體使用方法還不了解,那麼這篇教學就將為大家詳細介紹百度網盤app如何使用,還有疑惑的用戶們就快來跟著本文詳細了解一下吧!百度雲網盤怎麼用:一、安裝首先,下載並安裝百度雲軟體時,請選擇自訂安裝選
 BTCC教學:如何在BTCC交易所綁定使用MetaMask錢包?
Apr 26, 2024 am 09:40 AM
BTCC教學:如何在BTCC交易所綁定使用MetaMask錢包?
Apr 26, 2024 am 09:40 AM
MetaMask(中文也叫小狐狸錢包)是一款免費的、廣受好評的加密錢包軟體。目前,BTCC已支援綁定MetaMask錢包,綁定後可使用MetaMask錢包進行快速登錄,儲值、買幣等,且首次綁定還可獲得20USDT體驗金。在BTCCMetaMask錢包教學中,我們將詳細介紹如何註冊和使用MetaMask,以及如何在BTCC綁定並使用小狐狸錢包。 MetaMask錢包是什麼? MetaMask小狐狸錢包擁有超過3,000萬用戶,是當今最受歡迎的加密貨幣錢包之一。它可免費使用,可作為擴充功能安裝在網絡
 閒魚怎麼查看自己的id_閒魚個人暱稱查看方法介紹
Mar 22, 2024 am 08:21 AM
閒魚怎麼查看自己的id_閒魚個人暱稱查看方法介紹
Mar 22, 2024 am 08:21 AM
閒魚作為交易平台,使用前都需要先註冊和登入自己的帳號,用戶可以為自己的帳號設定id名稱,如果想查看自己的id是什麼怎麼辦呢?下面就來一起了解吧!閒魚個人暱稱檢視方法介紹先啟動閒魚應用,進入首頁後,透過切換到賣閒置、訊息、我的頁面,點選右下角的【我的】選項。 2、然後在我的頁面中我們需要點擊左上角的【頭像】;2、接著來到個人主頁的頁面中可以看到不同的信息,我們需要在這裡點擊【編輯資料】按鈕;4、最後點擊過後在編輯資料的頁面中我們就可以看到了;
 網易雲音樂在哪裡查看音樂排行榜_網易雲音樂查看音樂排行榜方法
Mar 25, 2024 am 11:40 AM
網易雲音樂在哪裡查看音樂排行榜_網易雲音樂查看音樂排行榜方法
Mar 25, 2024 am 11:40 AM
1.打開手機後,選擇網路易雲音樂。 2.進入首頁後,大家就可以看到【排行榜】,點選進入。 3.在排行榜中,可以選擇任意榜單,點選【新歌榜】。 4、選擇自己喜歡的歌曲,並進行點擊。 5.返回上一頁,可以看到更多的榜單。
 快手直播伴侶影片熱榜怎麼看
Mar 29, 2024 pm 08:09 PM
快手直播伴侶影片熱榜怎麼看
Mar 29, 2024 pm 08:09 PM
快手直播伴侶不僅是一個強大的直播輔助工具,更是一個為主播們打造的即時熱門話題和趨勢的洞察平台。透過這個功能,主播可以快速捕捉觀眾目前最關注的內容,進而調整直播內容,使其更符合觀眾的品味和興趣。那麼在快手直播伴侶app中如何查看影片熱榜呢,這篇教學攻略就將為大家帶來詳細的步驟介紹,希望能幫助到大家。快手直播伴侶怎麼看影片熱榜第二步,點選每日影片熱榜。第三步,即可查看每日影片熱榜了。
