
Boosting 是機器學習中用於提高模型準確性的整合學習技術。它結合了多個弱分類器(性能比隨機猜測稍好的模型)來創建強分類器。 boosting的主要目的是依序將弱分類器應用到資料上,修正先前的分類器所犯的錯誤,從而提高整體效能。
AdaBoost,Adaptive Boosting 的縮寫,是一種流行的 boosting 演算法。它調整錯誤分類實例的權重,以便後續分類器更關注困難的情況。 AdaBoost 的主要目的是透過在每次迭代中強調難以分類的範例來提高弱分類器的效能。
初始化權重:
訓練弱分類器:
計算分類器錯誤:
計算分類器權重:
更新實例的權重:
組合弱分類器:
AdaBoost 是 Adaptive Boosting 的縮寫,是一種結合多個弱分類器來創建強分類器的整合技術。此範例示範如何使用合成資料實現 AdaBoost 進行二元分類、評估模型的效能以及視覺化決策邊界。
1。導入庫
import numpy as np
import matplotlib.pyplot as plt
from sklearn.model_selection import train_test_split
from sklearn.ensemble import AdaBoostClassifier
from sklearn.tree import DecisionTreeClassifier
from sklearn.metrics import accuracy_score, confusion_matrix, classification_report
此區塊導入資料操作、繪圖和機器學習所需的庫。
2。產生樣本資料
np.random.seed(42)  # For reproducibility

# Generate synthetic data for 2 classes
n_samples = 1000
n_samples_per_class = n_samples // 2

# Class 0: Centered around (-1, -1)
X0 = np.random.randn(n_samples_per_class, 2) * 0.7 + [-1, -1]

# Class 1: Centered around (1, 1)
X1 = np.random.randn(n_samples_per_class, 2) * 0.7 + [1, 1]

# Combine the data
X = np.vstack([X0, X1])
y = np.hstack([np.zeros(n_samples_per_class), np.ones(n_samples_per_class)])

# Shuffle the dataset
shuffle_idx = np.random.permutation(n_samples)
X, y = X[shuffle_idx], y[shuffle_idx]
此區塊產生具有兩個特徵的合成數據,其中目標變數 y 是基於類別中心定義的,模擬二元分類場景。
3。分割資料集
X_train, X_test, y_train, y_test = train_test_split(X, y, test_size=0.2, random_state=42)
此區塊將資料集拆分為訓練集和測試集以進行模型評估。
4。建立並訓練 AdaBoost 分類器
base_estimator = DecisionTreeClassifier(max_depth=1)  # Decision stump
model = AdaBoostClassifier(estimator=base_estimator, n_estimators=3, random_state=42)
model.fit(X_train, y_train)
此區塊使用決策樹樁作為基本估計器來初始化 AdaBoost 模型,並使用訓練資料集對其進行訓練。
5。做出預測
y_pred = model.predict(X_test)
此區塊使用經過訓練的模型對測試集進行預測。
6。評估模型
accuracy = accuracy_score(y_test, y_pred)
conf_matrix = confusion_matrix(y_test, y_pred)
class_report = classification_report(y_test, y_pred)

print(f"Accuracy: {accuracy:.4f}")
print("\nConfusion Matrix:")
print(conf_matrix)
print("\nClassification Report:")
print(class_report)
輸出:
Accuracy: 0.9400

Confusion Matrix:
[[96  8]
 [ 4 92]]

Classification Report:
              precision    recall  f1-score   support

         0.0       0.96      0.92      0.94       104
         1.0       0.92      0.96      0.94        96

    accuracy                           0.94       200
   macro avg       0.94      0.94      0.94       200
weighted avg       0.94      0.94      0.94       200
此區塊計算並列印準確性、混淆矩陣和分類報告,提供對模型效能的深入了解。
7。可視化決策邊界
x_min, x_max = X[:, 0].min() - 1, X[:, 0].max() + 1
y_min, y_max = X[:, 1].min() - 1, X[:, 1].max() + 1
xx, yy = np.meshgrid(np.arange(x_min, x_max, 0.1),
                     np.arange(y_min, y_max, 0.1))
Z = model.predict(np.c_[xx.ravel(), yy.ravel()])
Z = Z.reshape(xx.shape)

plt.figure(figsize=(10, 8))
plt.contourf(xx, yy, Z, alpha=0.4, cmap='RdYlBu')
scatter = plt.scatter(X[:, 0], X[:, 1], c=y, cmap='RdYlBu', edgecolor='black')
plt.xlabel("Feature 1")
plt.ylabel("Feature 2")
plt.title("AdaBoost Binary Classification")
plt.colorbar(scatter)
plt.show()
This block visualizes the decision boundary created by the AdaBoost model, illustrating how the model separates the two classes in the feature space.
Output:

This structured approach demonstrates how to implement and evaluate AdaBoost for binary classification tasks, providing a clear understanding of its capabilities. The visualization of the decision boundary aids in interpreting the model's predictions.
AdaBoost is an ensemble learning technique that combines multiple weak classifiers to create a strong classifier. This example demonstrates how to implement AdaBoost for multiclass classification using synthetic data, evaluate the model's performance, and visualize the decision boundary for five classes.
1. Import Libraries
import numpy as np
import matplotlib.pyplot as plt
from sklearn.model_selection import train_test_split
from sklearn.ensemble import AdaBoostClassifier
from sklearn.tree import DecisionTreeClassifier
from sklearn.metrics import accuracy_score, confusion_matrix, classification_report
This block imports the necessary libraries for data manipulation, plotting, and machine learning.
2. Generate Sample Data with 5 Classes
np.random.seed(42)  # For reproducibility
n_samples = 2500  # Total number of samples
n_samples_per_class = n_samples // 5  # Ensure this is exactly n_samples // 5

# Class 0: Centered around (-2, -2)
X0 = np.random.randn(n_samples_per_class, 2) * 0.5 + [-2, -2]

# Class 1: Centered around (0, -2)
X1 = np.random.randn(n_samples_per_class, 2) * 0.5 + [0, -2]

# Class 2: Centered around (2, -2)
X2 = np.random.randn(n_samples_per_class, 2) * 0.5 + [2, -2]

# Class 3: Centered around (-1, 2)
X3 = np.random.randn(n_samples_per_class, 2) * 0.5 + [-1, 2]

# Class 4: Centered around (1, 2)
X4 = np.random.randn(n_samples_per_class, 2) * 0.5 + [1, 2]

# Combine the data
X = np.vstack([X0, X1, X2, X3, X4])
y = np.hstack([np.zeros(n_samples_per_class),
               np.ones(n_samples_per_class),
               np.full(n_samples_per_class, 2),
               np.full(n_samples_per_class, 3),
               np.full(n_samples_per_class, 4)])

# Shuffle the dataset
shuffle_idx = np.random.permutation(n_samples)
X, y = X[shuffle_idx], y[shuffle_idx]
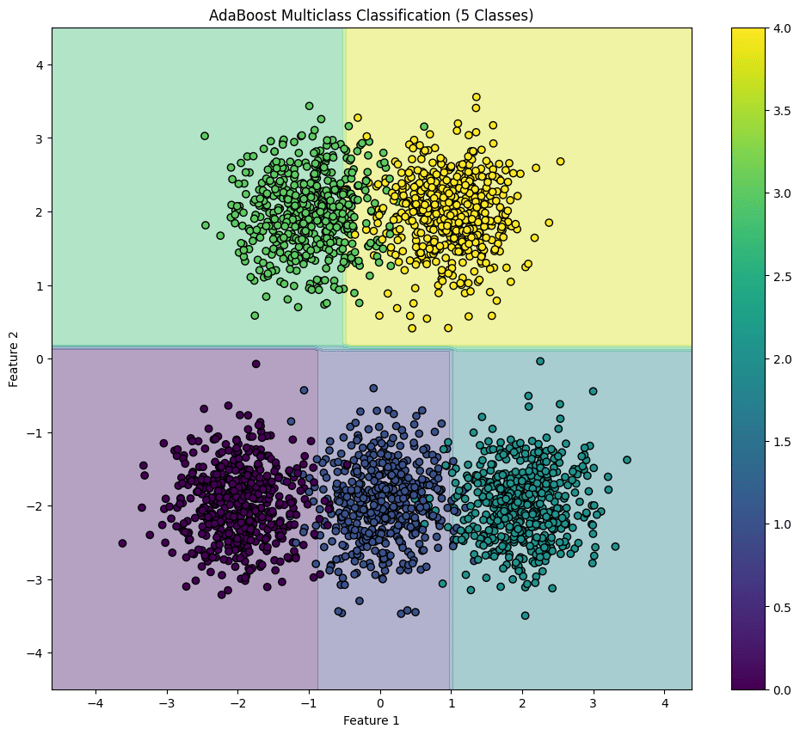
This block generates synthetic data for five classes located in different regions of the feature space.
3. Split the Dataset
X_train, X_test, y_train, y_test = train_test_split(X, y, test_size=0.2, random_state=42)
This block splits the dataset into training and testing sets for model evaluation.
4. Create and Train the AdaBoost Classifier
base_estimator = DecisionTreeClassifier(max_depth=1)  # Decision stump
model = AdaBoostClassifier(estimator=base_estimator, n_estimators=10, random_state=42)
model.fit(X_train, y_train)
This block initializes the AdaBoost classifier with a weak learner (decision stump) and trains it using the training dataset.
5. Make Predictions
y_pred = model.predict(X_test)
This block uses the trained model to make predictions on the test set.
6. Evaluate the Model
accuracy = accuracy_score(y_test, y_pred)
conf_matrix = confusion_matrix(y_test, y_pred)
class_report = classification_report(y_test, y_pred)

print(f"Accuracy: {accuracy:.4f}")
print("\nConfusion Matrix:")
print(conf_matrix)
print("\nClassification Report:")
print(class_report)
Output:
Accuracy: 0.9540

Confusion Matrix:
[[ 97   2   0   0   0]
 [  0  92   3   0   0]
 [  0   4  92   0   0]
 [  0   0   0  86  14]
 [  0   0   0   0 110]]

Classification Report:
              precision    recall  f1-score   support

         0.0       1.00      0.98      0.99        99
         1.0       0.94      0.97      0.95        95
         2.0       0.97      0.96      0.96        96
         3.0       1.00      0.86      0.92       100
         4.0       0.89      1.00      0.94       110

    accuracy                           0.95       500
   macro avg       0.96      0.95      0.95       500
weighted avg       0.96      0.95      0.95       500
This block calculates and prints the accuracy, confusion matrix, and classification report, providing insights into the model's performance.
7. Visualize the Decision Boundary
x_min, x_max = X[:, 0].min() - 1, X[:, 0].max() + 1
y_min, y_max = X[:, 1].min() - 1, X[:, 1].max() + 1
xx, yy = np.meshgrid(np.arange(x_min, x_max, 0.1),
                     np.arange(y_min, y_max, 0.1))
Z = model.predict(np.c_[xx.ravel(), yy.ravel()])
Z = Z.reshape(xx.shape)

plt.figure(figsize=(12, 10))
plt.contourf(xx, yy, Z, alpha=0.4, cmap='viridis')
scatter = plt.scatter(X[:, 0], X[:, 1], c=y, cmap='viridis', edgecolor='black')
plt.xlabel("Feature 1")
plt.ylabel("Feature 2")
plt.title("AdaBoost Multiclass Classification (5 Classes)")
plt.colorbar(scatter)
plt.show()
This block visualizes the decision boundaries created by the AdaBoost classifier, illustrating how the model separates the five classes in the feature space.
Output:
This structured approach demonstrates how to implement and evaluate AdaBoost for multiclass classification tasks, providing a clear understanding of its capabilities and the effectiveness of visualizing decision boundaries.
以上是AdaBoost - 整合方法,分類:監督機器學習的詳細內容。更多資訊請關注PHP中文網其他相關文章!


