

timeit.repeat - 透過重複來理解模式

1.問題
在您的軟體工程職業生涯中,您可能會遇到一段效能不佳的程式碼,花費的時間超出了可接受的範圍。更糟的是,多次執行時效能不一致且變化很大。
此時,您必須接受這樣的事實:在軟體效能方面,存在著許多不確定性。資料可以分佈在一個視窗內,有時遵循常態分佈。其他時候,它可能會不穩定,沒有明顯的模式。
2. 方法
這就是基準測試發揮作用的時候。執行程式碼五次固然很好,但最終,您只有五個數據點,每個數據點都具有太多價值。我們需要對同一程式碼區塊進行更多次的重複才能看到模式。
3.問題
一個人應該有多少個數據點?關於它已經有很多文章了,我報道過其中一篇論文
嚴格的效能評估需要建立基準,
多次執行和測量以處理隨機
執行時間的變化。研究者應該提供措施
報告結果時的變化。
Kalibera, T. 與 Jones, R. (2013)。在合理的時間內進行嚴格的基準測試。 2013 年記憶體管理國際研討會論文集。 https://doi.org/10.1145/2491894.2464160
在測量效能時,我們可能想要測量 CPU、記憶體或磁碟使用情況,以便更全面地了解效能。通常最好從簡單的事情開始,例如流逝的時間,因為它更容易形象化。 17% 的 CPU 使用率並不能告訴我們太多。應該是什麼? 20%還是5%? CPU 使用率並不是人類感知效能的自然方式之一。
4. 實驗
我將使用 python 的 timeit.repeat 方法來重複一個簡單的程式碼執行區塊。該程式碼區塊只是將 1 到 2000 之間的數字相乘。
from functools import reduce
reduce((lambda x, y: x * y), range(1, 2000))
這是方法簽章
(function) def repeat(
    stmt: _Stmt = "pass",
    setup: _Stmt = "pass",
    timer: _Timer = ...,
    repeat: int = 5,
    number: int = 1000000,
    globals: dict[str, Any] | None = None
) -> list[float]
什麼是重複和數字?
讓我們從數字開始。如果程式碼區塊太小,它會很快終止,以至於您無法測量任何內容。這個參數提到了 stmt 必須執行的次數。您可以將其視為新的程式碼區塊。傳回的浮點數是 stmt X 號執行時間。
在我們的例子中,我們將數字保留為 1000,因為乘法到 2000 的成本很高。
接下來,繼續重複。這指定了上述區塊必須執行的重複次數或次數。如果重複次數為 5,則 list[float] 傳回 5 個元素。
讓我們從建立一個簡單的執行區塊開始
def run_experiment(number_of_repeats, number_of_runs=1000):
    execution_time = timeit.repeat(
        "from functools import reduce; reduce((lambda x, y: x * y), range(1, 2000))",
        repeat=number_of_repeats,
        number=number_of_runs
    )
    return execution_time
我們希望以不同的重複值執行它
repeat_values = [5, 20, 100, 500, 3000, 10000]
程式碼非常簡單明了
5. 探索結果
現在我們到達了實驗中最重要的部分 - 解釋數據。請注意,不同的人有不同的解釋,並且沒有單一的正確答案。
您對正確答案的定義很大程度取決於您想要實現的目標。您是否擔心 95% 用戶的效能下降?或者,您是否擔心尾部 5% 的直言不諱的用戶的效能下降?
5.1.多個重複值的執行時間分析統計
正如我們所看到的,最短和最長時間是奇怪的。它展示了一個數據點如何足以改變平均值。最糟糕的是,高最小值和高最大值適用於不同的重複值。沒有相關性,它只是展示了異常值的力量。
接下來我們轉向中位數,並注意到隨著重複次數的增加,中位數會下降,除了 20 之外。可以用什麼解釋呢?它只是表明,較少的重複次數意味著我們不一定能全面了解可能的值。
轉向截斷平均值,其中最低的 2.5% 和最高的 2.5% 被修剪掉。當您不關心異常用戶並希望關注中間 95% 用戶的表現時,這非常有用。
請注意,嘗試提高中間 95% 用戶的效能可能會降低異常 5% 用戶的效能。

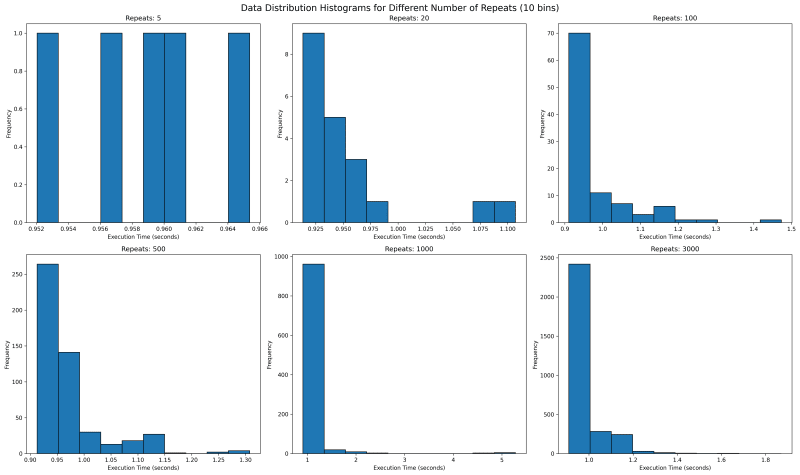
5.2. Execution Time Distribution for multiple values of repeat
Next we want to see where all the data lies. We would use histogram with bin of 10 to see where the data falls. With repetitions of 5 we see that they are mostly equally spaced. This is not one usually expects as sampled data should follow a normal looking distribution.
In our case the value is bounded on the lower side and unbounded on the upper side, since it will take more than 0 seconds to run any code, but there is no upper time limit. This means our distribution should look like a normal distribution with a long right tail.
Going forward with higher values of repeat, we see a tail emerging on the right. I would expect with higher number of repeat, there would be a single histogram bar, which is tall enough that outliers are overshadowed.
5.3. Execution Time Distribution for values 1000 and 3000
How about we look at larger values of repeat to get a sense? We see something unusual. With 1000 repeats, there are a lot of outliers past 1.8 and it looks a lot more tighter. The one on the right with 3000 repeat only goes upto 1.8 and has most of its data clustered around two peaks.
What can it mean? It can mean a lot of things including the fact that sometimes maybe the data gets cached and at times it does not. It can point to many other side effects of your code, which you might have never thought of. With the kind of distribution of both 1000 and 3000 repeats, I feel the TM95 for 3000 repeat is the most accurate value.

6. Appendix
6.1. Code
import timeit
import matplotlib.pyplot as plt
import json
import os
import statistics
import numpy as np

def run_experiment(number_of_repeats, number_of_runs=1000):
    execution_time = timeit.repeat(
        "from functools import reduce; reduce((lambda x, y: x * y), range(1, 2000))",
        repeat=number_of_repeats,
        number=number_of_runs
    )
    return execution_time

def save_result(result, repeats):
    filename = f'execution_time_results_{repeats}.json'
    with open(filename, 'w') as f:
        json.dump(result, f)

def load_result(repeats):
    filename = f'execution_time_results_{repeats}.json'
    if os.path.exists(filename):
        with open(filename, 'r') as f:
            return json.load(f)
    return None

def truncated_mean(data, percentile=95):
    data = np.array(data)
    lower_bound = np.percentile(data, (100 - percentile) / 2)
    upper_bound = np.percentile(data, 100 - (100 - percentile) / 2)
    return np.mean(data[(data >= lower_bound) & (data <= upper_bound)])

# List of number_of_repeats to test
repeat_values = [5, 20, 100, 500, 1000, 3000]

# Run experiments and collect results
results = []
for repeats in repeat_values:
    result = load_result(repeats)
    if result is None:
        print(f"Running experiment for {repeats} repeats...")
        try:
            result = run_experiment(repeats)
            save_result(result, repeats)
            print(f"Experiment for {repeats} repeats completed and saved.")
        except KeyboardInterrupt:
            print(f"\nExperiment for {repeats} repeats interrupted.")
            continue
    else:
        print(f"Loaded existing results for {repeats} repeats.")

    # Print time taken per repetition
    avg_time = statistics.mean(result)
    print(f"Average time per repetition for {repeats} repeats: {avg_time:.6f} seconds")

    results.append(result)

trunc_means = [truncated_mean(r) for r in results]
medians = [np.median(r) for r in results]
mins = [np.min(r) for r in results]
maxs = [np.max(r) for r in results]

# Create subplots
fig, axs = plt.subplots(2, 2, figsize=(15, 12))
fig.suptitle('Execution Time Analysis for Different Number of Repeats', fontsize=16)

metrics = [
    ('Truncated Mean (95%)', trunc_means),
    ('Median', medians),
    ('Min', mins),
    ('Max', maxs)
]

for (title, data), ax in zip(metrics, axs.flatten()):
    ax.plot(repeat_values, data, marker='o')
    ax.set_title(title)
    ax.set_xlabel('Number of Repeats')
    ax.set_ylabel('Execution Time (seconds)')
    ax.set_xscale('log')
    ax.grid(True, which="both", ls="-", alpha=0.2)

    # Set x-ticks and labels for each data point
    ax.set_xticks(repeat_values)
    ax.set_xticklabels(repeat_values)

    # Rotate x-axis labels for better readability
    ax.tick_params(axis='x', rotation=45)

plt.tight_layout()

# Save the plot to a file
plt.savefig('execution_time_analysis.png', dpi=300, bbox_inches='tight')
print("Plot saved as 'execution_time_analysis.png'")

# Create histograms for data distribution with 10 bins
fig, axs = plt.subplots(2, 3, figsize=(20, 12))
fig.suptitle('Data Distribution Histograms for Different Number of Repeats (10 bins)', fontsize=16)

for repeat, result, ax in zip(repeat_values, results, axs.flatten()):
    ax.hist(result, bins=10, edgecolor='black')
    ax.set_title(f'Repeats: {repeat}')
    ax.set_xlabel('Execution Time (seconds)')
    ax.set_ylabel('Frequency')

plt.tight_layout()

# Save the histograms to a file
plt.savefig('data_distribution_histograms_10bins.png', dpi=300, bbox_inches='tight')
print("Histograms saved as 'data_distribution_histograms_10bins.png'")

# Create histograms for 1000 and 3000 repeats with 30 bins
fig, axs = plt.subplots(1, 2, figsize=(15, 6))
fig.suptitle('Data Distribution Histograms for 1000 and 3000 Repeats (30 bins)', fontsize=16)

for repeat, result, ax in zip([1000, 3000], results[-2:], axs):
    ax.hist(result, bins=100, edgecolor='black')
    ax.set_title(f'Repeats: {repeat}')
    ax.set_xlabel('Execution Time (seconds)')
    ax.set_ylabel('Frequency')

plt.tight_layout()

# Save the detailed histograms to a file
plt.savefig('data_distribution_histograms_detailed.png', dpi=300, bbox_inches='tight')
print("Detailed histograms saved as 'data_distribution_histograms_detailed.png'")

plt.show()
以上是timeit.repeat - 透過重複來理解模式的詳細內容。更多資訊請關注PHP中文網其他相關文章!

熱AI工具

Undresser.AI Undress
人工智慧驅動的應用程序,用於創建逼真的裸體照片

AI Clothes Remover
用於從照片中去除衣服的線上人工智慧工具。

Undress AI Tool
免費脫衣圖片

Clothoff.io
AI脫衣器

Video Face Swap
使用我們完全免費的人工智慧換臉工具,輕鬆在任何影片中換臉!

熱門文章
熱工具

記事本++7.3.1
好用且免費的程式碼編輯器

SublimeText3漢化版
中文版,非常好用

禪工作室 13.0.1
強大的PHP整合開發環境

Dreamweaver CS6
視覺化網頁開發工具

SublimeText3 Mac版
神級程式碼編輯軟體(SublimeText3)


 Python與C:學習曲線和易用性
Apr 19, 2025 am 12:20 AM
Python與C:學習曲線和易用性
Apr 19, 2025 am 12:20 AM
Python更易學且易用,C 則更強大但複雜。 1.Python語法簡潔,適合初學者,動態類型和自動內存管理使其易用,但可能導致運行時錯誤。 2.C 提供低級控制和高級特性,適合高性能應用,但學習門檻高,需手動管理內存和類型安全。
 學習Python:2小時的每日學習是否足夠?
Apr 18, 2025 am 12:22 AM
學習Python:2小時的每日學習是否足夠?
Apr 18, 2025 am 12:22 AM
每天學習Python兩個小時是否足夠?這取決於你的目標和學習方法。 1)制定清晰的學習計劃,2)選擇合適的學習資源和方法,3)動手實踐和復習鞏固,可以在這段時間內逐步掌握Python的基本知識和高級功能。
 Python vs.C:探索性能和效率
Apr 18, 2025 am 12:20 AM
Python vs.C:探索性能和效率
Apr 18, 2025 am 12:20 AM
Python在開發效率上優於C ,但C 在執行性能上更高。 1.Python的簡潔語法和豐富庫提高開發效率。 2.C 的編譯型特性和硬件控制提升執行性能。選擇時需根據項目需求權衡開發速度與執行效率。
 Python vs. C:了解關鍵差異
Apr 21, 2025 am 12:18 AM
Python vs. C:了解關鍵差異
Apr 21, 2025 am 12:18 AM
Python和C 各有優勢,選擇應基於項目需求。 1)Python適合快速開發和數據處理,因其簡潔語法和動態類型。 2)C 適用於高性能和系統編程,因其靜態類型和手動內存管理。
 Python標準庫的哪一部分是:列表或數組?
Apr 27, 2025 am 12:03 AM
Python標準庫的哪一部分是:列表或數組?
Apr 27, 2025 am 12:03 AM
pythonlistsarepartofthestAndArdLibrary,herilearRaysarenot.listsarebuilt-In,多功能,和Rused ForStoringCollections,而EasaraySaraySaraySaraysaraySaraySaraysaraySaraysarrayModuleandleandleandlesscommonlyusedDduetolimitedFunctionalityFunctionalityFunctionality。
 Python:自動化,腳本和任務管理
Apr 16, 2025 am 12:14 AM
Python:自動化,腳本和任務管理
Apr 16, 2025 am 12:14 AM
Python在自動化、腳本編寫和任務管理中表現出色。 1)自動化:通過標準庫如os、shutil實現文件備份。 2)腳本編寫:使用psutil庫監控系統資源。 3)任務管理:利用schedule庫調度任務。 Python的易用性和豐富庫支持使其在這些領域中成為首選工具。
 科學計算的Python:詳細的外觀
Apr 19, 2025 am 12:15 AM
科學計算的Python:詳細的外觀
Apr 19, 2025 am 12:15 AM
Python在科學計算中的應用包括數據分析、機器學習、數值模擬和可視化。 1.Numpy提供高效的多維數組和數學函數。 2.SciPy擴展Numpy功能,提供優化和線性代數工具。 3.Pandas用於數據處理和分析。 4.Matplotlib用於生成各種圖表和可視化結果。
 Web開發的Python:關鍵應用程序
Apr 18, 2025 am 12:20 AM
Web開發的Python:關鍵應用程序
Apr 18, 2025 am 12:20 AM
Python在Web開發中的關鍵應用包括使用Django和Flask框架、API開發、數據分析與可視化、機器學習與AI、以及性能優化。 1.Django和Flask框架:Django適合快速開發複雜應用,Flask適用於小型或高度自定義項目。 2.API開發:使用Flask或DjangoRESTFramework構建RESTfulAPI。 3.數據分析與可視化:利用Python處理數據並通過Web界面展示。 4.機器學習與AI:Python用於構建智能Web應用。 5.性能優化:通過異步編程、緩存和代碼優
