

使用 Google Apps 腳本和 Leaflet.js 建立互動式 XY 圖像圖

Google 地圖有大量用於在地圖上繪製點的功能,但是如果您想在圖像上繪製點怎麼辦?這些 XY 影像繪圖通常用於樓層地圖、工作現場檢查,甚至是遊戲。
在本指南中,我將向您展示如何使用 Leaflet.js 和 Google Apps 腳本建立具有可拖曳點的互動式地圖。我們將涵蓋從設定地圖到整合 Google 試算表中的資料以及將其部署為網頁應用程式的所有內容。
本指南將涵蓋:
在 Google Apps 腳本 HTML 服務中設定 Leaflet.js
使用 Google 表格中的資料顯示標記
移動標記時更新表格行
從地圖建立新標記並儲存到表格
從網路應用程式中刪除標記
在 Google Apps 腳本 HTML 服務中設定 Leaflet.js
Leaflet.js 是最受歡迎的開源地圖庫之一。它重量輕,易於使用,並且有很好的文件。它們支援大量不同的地圖類型,包括“CRS.Simple”或坐標參考系統,它允許您提供背景圖像。
Google 試算表設定
先建立一個名為map_pin 的工作表,其架構如下:
| id | title | x | y |
|---|---|---|---|
| 1 | test1 | 10 | 30 |
| 2 | test2 | 50 | 80 |
Then open Apps Script from the Extensions menu.
Creating HTML File
First, we'll start with the basic example from the Leaflet docs, just to get the library working. You can see the full example in their quick start guide, here.
Add a new HTML File named Index, and set the content to:
<!DOCTYPE html>
<html>
<head>
<title>Quick Start - Leaflet</title>
<meta charset="utf-8" />
<meta name="viewport" content="width=device-width, initial-scale=1.0">
<link rel="stylesheet" href="https://unpkg.com/leaflet@1.9.3/dist/leaflet.css" />
<style>
#map {
height: 400px;
}
</style>
</head>
<body>
<div id="map"></div>
<script src="https://unpkg.com/leaflet@1.9.3/dist/leaflet.js"></script>
<script>
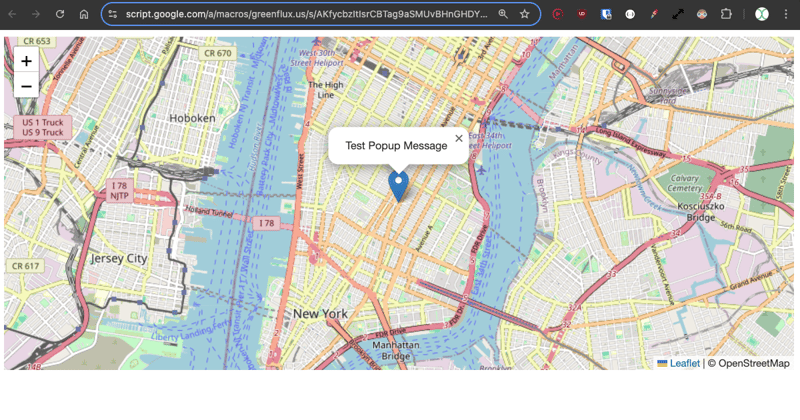
var map = L.map('map').setView([40.73, -73.99], 13);
L.tileLayer('https://{s}.tile.openstreetmap.org/{z}/{x}/{y}.png', {
maxZoom: 19,
attribution: '© OpenStreetMap'
}).addTo(map);
var marker = L.marker([40.73, -73.99]).addTo(map)
.bindPopup('Test Popup Message')
.openPopup();
</script>
</body>
</html>
Then update the Code.gs file with:
function doGet() {
  const html = HtmlService.createHtmlOutputFromFile('Index')
    .setTitle('Map with Draggable Points')
    .setXFrameOptionsMode(HtmlService.XFrameOptionsMode.ALLOWALL);
  return html;
}
Save, and then click Deploy, and publish as a web app. Then open the link for the new deployment and you should see Leaflet.js displaying a map on New York.
Ok, that's the regular map example using Leaflet. Now on to the CRS.Simple map type, which allows supplying a background image.
Update the HTML with this example from the Leaflet Tutorials.
<!DOCTYPE html>
<html>
<head>
<title>CRS Simple Example - Leaflet</title>
<meta charset="utf-8" />
<meta name="viewport" content="width=device-width, initial-scale=1.0">
<link rel="stylesheet" href="https://unpkg.com/leaflet@1.9.3/dist/leaflet.css" />
<style>
#map {
height: 400px;
width: 600px;
}
body {
margin: 0;
padding: 0;
}
</style>
</head>
<body>
<div id="map"></div>
<script src="https://unpkg.com/leaflet@1.9.3/dist/leaflet.js"></script>
<script>
// Set up the map with a simple CRS (no geographic projection)
var map = L.map('map', {
crs: L.CRS.Simple,
minZoom: -1,
maxZoom: 4
});
// Define the dimensions of the image
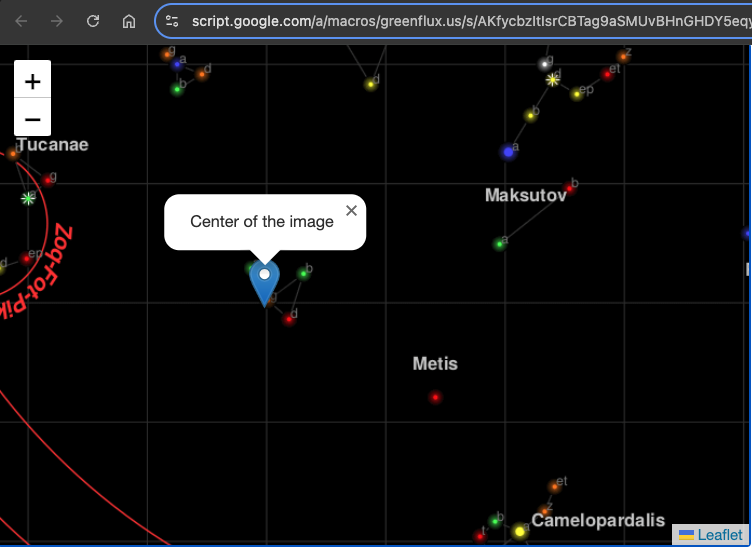
var bounds = [[0, 0], [1000, 1000]];
var image = L.imageOverlay('https://leafletjs.com/examples/crs-simple/uqm_map_full.png', bounds).addTo(map);
// Set the initial view of the map to show the whole image
map.fitBounds(bounds);
// Optional: Add a marker or other elements to the map
var marker = L.marker([500, 500]).addTo(map)
.bindPopup('Center of the image')
.openPopup();
</script>
</body>
</html>
Here we are supplying an image of 1000 x 1000 pixels, then setting the center marker at 500, 500.
Click Save, then Deploy>Test Deployments, to see the new map type. You should now have a map with a background image and a marker plotted in the center.
Initializing a Map with Data from Google Sheets
Next, we'll use data from the sheet to populate a set of markers on the map.
First, add a function to the Code.gs file to get the marker locations:
function getPinData(){
  const ss = SpreadsheetApp.getActiveSpreadsheet();
  const sh = ss.getSheetByName('map_pin');
  const data = sh.getDataRange().getValues();
  const json = arrayToJSON(data);
  //Logger.log(json);
  return json
}

function arrayToJSON(data=getPinData()){
  const headers = data[0];
  const rows = data.slice(1);
  let jsonData = [];
  for(row of rows){
    const obj = {};
    headers.forEach((h,i)=>obj[h] = row[i]);
    jsonData.push(obj)
  }
  //Logger.log(jsonData)
  return jsonData
}
Here I'm returning the pins as JSON so they're easier to work with in the HTML in the next section.
Now add a function to the HTML to loop over this JSON and create the map pins after the map has loaded.
// Add map pins from sheet data
    google.script.run.withSuccessHandler(addMarkers).getPinData();

    function addMarkers(mapPinData) {
      mapPinData.forEach(pin => {
        const marker = L.marker([pin.x, pin.y], {
          draggable: true
        }).addTo(map);

        marker.bindPopup(`<b>${pin.title}`).openPopup();

        marker.on('dragend', function(e) {
          const latLng = e.target.getLatLng();
          console.log(`Marker ${pin.title} moved to: ${latLng.lat}, ${latLng.lng}`);
        });
      });
    }
Save, and then open the test deployment. You should now have markers generated from your sheet data!
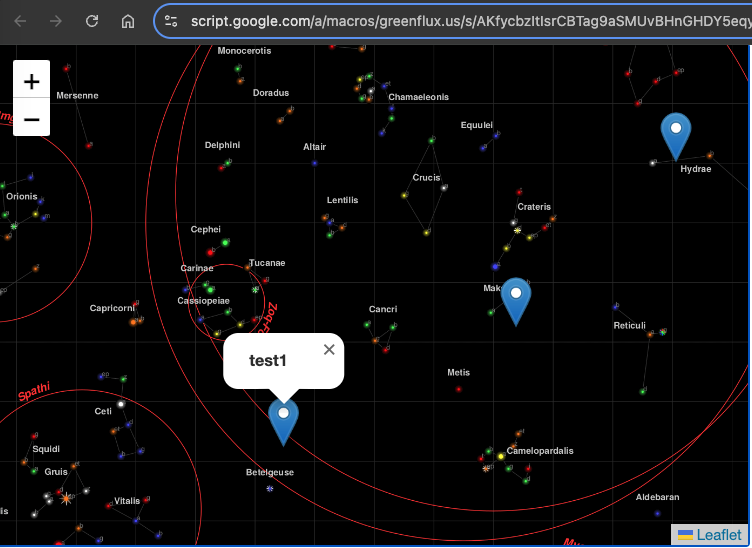
Each pin has a popup with the title from that row. The pins are draggable at this point, but we still need a function to save the new position.
Saving Marker Position When Dragged
To save the new position, we need two functions: one in the HTML to capture the event on the client side, and one to save the new position on the server side, in the Code.gs file.
Update the HTML with:
    function addMarkers(mapPinData) {
      mapPinData.forEach(pin => {
        const { id, title, x, y } = pin;
        const marker = L.marker([x, y], {
          draggable: true
        }).addTo(map);

        marker.bindPopup(`<b>${title}</b>`).openPopup();

        marker.on('dragend', function(e) {
          const latLng = e.target.getLatLng();
          console.log(`Marker ${title} moved to: ${latLng.lat}, ${latLng.lng}`);
          saveMarkerPosition({ id, title, lat: latLng.lat, lng: latLng.lng });
        });
      });
    }

    function saveMarkerPosition({ id, title, lat, lng }) {
      google.script.run.saveMarkerPosition({ id, title, lat, lng });
    }
And then add a function to the Code.gs file to save the location:
function saveMarkerPosition({ id, lat, lng }) {
  const ss = SpreadsheetApp.getActiveSpreadsheet();
  const sh = ss.getSheetByName('map_pin');
  const data = sh.getDataRange().getValues();

  for (let i = 1; i < data.length; i++) {
    if (data[i][0] === id) {  // ID column (index 0)
      sh.getRange(i + 1, 3).setValue(lat);  // latitude column
      sh.getRange(i + 1, 4).setValue(lng);  // longitude column
      break;
    }
  }
}
Save, and refresh the test deployment. You should now see the sheet update when a marker is dragged!
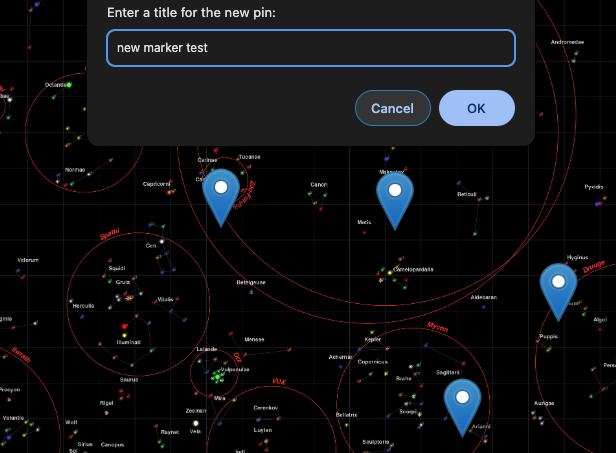
Adding New Points
We can now move the existing points, but what about adding new ones? Again, we'll need two functions, one in the HTML, and one in the Code.gs file.
First, add a function to the HTML to open a prompt when the user clicks an empty spot on the map, and pass the value to a server function.
    // Function to add a new pin
    map.on('click', function(e) {
      const latLng = e.latlng;
      const title = prompt('Enter a title for the new pin:');
      if (title) {
        google.script.run.withSuccessHandler(function(id) {
          addNewMarker({ id, title, lat: latLng.lat, lng: latLng.lng });
        }).addNewPin({ title, lat: latLng.lat, lng: latLng.lng });
      }
    });

    function addNewMarker({ id, title, lat, lng }) {
      const marker = L.marker([lat, lng], {
        draggable: true
      }).addTo(map);

      marker.bindPopup(`<b>${title}</b>`).openPopup();

      marker.on('dragend', function(e) {
        const latLng = e.target.getLatLng();
        saveMarkerPosition({ id, title, lat: latLng.lat, lng: latLng.lng });
      });
    }
Then add the function to the Code.gs to save the new row.
function addNewPin({ title, lat, lng }) {
  const ss = SpreadsheetApp.getActiveSpreadsheet();
  const sh = ss.getSheetByName('map_pin');

  // Check if there are any rows present, if not initialize ID
  const lastRow = sh.getLastRow();
  let newId = 1;

  if (lastRow > 0) {
    const lastId = sh.getRange(lastRow, 1).getValue();
    newId = lastId + 1;
  }

  sh.appendRow([newId, title, lat, lng]);

  return newId;
}
Save once more and refresh the test deployment. Now when you click an empty spot, you can enter a title and save a new marker!
Deleting A Marker
Lastly, we should add a way to delete markers, giving us a full CRUD app in map view.
Update the add marker function to give the popup a delete button:
      const popupContent = `<b>${title}</b><br><button onclick="deleteMarker(${id})">Delete Marker</button>`;
      marker.bindPopup(popupContent).openPopup();
And then add a function for deleting from the client side:
// Function to delete a marker
  function deleteMarker(id) {
    const confirmed = confirm('Are you sure you want to delete this marker?');
    if (confirmed) {
      google.script.run.withSuccessHandler(() => {
        // Refresh the markers after deletion
        google.script.run.withSuccessHandler(addMarkers).getPinData();
      }).deleteMarker(id);
    }
  }
Then add the matching function to the Code.gs file:
function deleteMarker(id) {
  const ss = SpreadsheetApp.getActiveSpreadsheet();
  const sh = ss.getSheetByName('map_pin');
  const data = sh.getDataRange().getValues();

  for (let i = 1; i < data.length; i++) {
    if (data[i][0] === id) {  // ID column (index 0)
      sh.deleteRow(i + 1);  // Delete the row
      break;
    }
  }
}
What's Next?
There's a ton more you could do from here, like adding other data points to each marker, dynamic background images, or other click and drag interactions. You could even make a game! Got an idea for a use case? Drop a comment below!
以上是使用 Google Apps 腳本和 Leaflet.js 建立互動式 XY 圖像圖的詳細內容。更多資訊請關注PHP中文網其他相關文章!

熱AI工具

Undresser.AI Undress
人工智慧驅動的應用程序,用於創建逼真的裸體照片

AI Clothes Remover
用於從照片中去除衣服的線上人工智慧工具。

Undress AI Tool
免費脫衣圖片

Clothoff.io
AI脫衣器

Video Face Swap
使用我們完全免費的人工智慧換臉工具,輕鬆在任何影片中換臉!

熱門文章
熱工具

記事本++7.3.1
好用且免費的程式碼編輯器

SublimeText3漢化版
中文版,非常好用

禪工作室 13.0.1
強大的PHP整合開發環境

Dreamweaver CS6
視覺化網頁開發工具

SublimeText3 Mac版
神級程式碼編輯軟體(SublimeText3)


 神秘的JavaScript:它的作用以及為什麼重要
Apr 09, 2025 am 12:07 AM
神秘的JavaScript:它的作用以及為什麼重要
Apr 09, 2025 am 12:07 AM
JavaScript是現代Web開發的基石,它的主要功能包括事件驅動編程、動態內容生成和異步編程。 1)事件驅動編程允許網頁根據用戶操作動態變化。 2)動態內容生成使得頁面內容可以根據條件調整。 3)異步編程確保用戶界面不被阻塞。 JavaScript廣泛應用於網頁交互、單頁面應用和服務器端開發,極大地提升了用戶體驗和跨平台開發的靈活性。
 誰得到更多的Python或JavaScript?
Apr 04, 2025 am 12:09 AM
誰得到更多的Python或JavaScript?
Apr 04, 2025 am 12:09 AM
Python和JavaScript開發者的薪資沒有絕對的高低,具體取決於技能和行業需求。 1.Python在數據科學和機器學習領域可能薪資更高。 2.JavaScript在前端和全棧開發中需求大,薪資也可觀。 3.影響因素包括經驗、地理位置、公司規模和特定技能。
 如何實現視差滾動和元素動畫效果,像資生堂官網那樣?
或者:
怎樣才能像資生堂官網一樣,實現頁面滾動伴隨的動畫效果?
Apr 04, 2025 pm 05:36 PM
如何實現視差滾動和元素動畫效果,像資生堂官網那樣?
或者:
怎樣才能像資生堂官網一樣,實現頁面滾動伴隨的動畫效果?
Apr 04, 2025 pm 05:36 PM
實現視差滾動和元素動畫效果的探討本文將探討如何實現類似資生堂官網(https://www.shiseido.co.jp/sb/wonderland/)中�...
 JavaScript的演變:當前的趨勢和未來前景
Apr 10, 2025 am 09:33 AM
JavaScript的演變:當前的趨勢和未來前景
Apr 10, 2025 am 09:33 AM
JavaScript的最新趨勢包括TypeScript的崛起、現代框架和庫的流行以及WebAssembly的應用。未來前景涵蓋更強大的類型系統、服務器端JavaScript的發展、人工智能和機器學習的擴展以及物聯網和邊緣計算的潛力。
 如何使用JavaScript將具有相同ID的數組元素合併到一個對像中?
Apr 04, 2025 pm 05:09 PM
如何使用JavaScript將具有相同ID的數組元素合併到一個對像中?
Apr 04, 2025 pm 05:09 PM
如何在JavaScript中將具有相同ID的數組元素合併到一個對像中?在處理數據時,我們常常會遇到需要將具有相同ID�...
 JavaScript引擎:比較實施
Apr 13, 2025 am 12:05 AM
JavaScript引擎:比較實施
Apr 13, 2025 am 12:05 AM
不同JavaScript引擎在解析和執行JavaScript代碼時,效果會有所不同,因為每個引擎的實現原理和優化策略各有差異。 1.詞法分析:將源碼轉換為詞法單元。 2.語法分析:生成抽象語法樹。 3.優化和編譯:通過JIT編譯器生成機器碼。 4.執行:運行機器碼。 V8引擎通過即時編譯和隱藏類優化,SpiderMonkey使用類型推斷系統,導致在相同代碼上的性能表現不同。
 前端開發中如何實現類似 VSCode 的面板拖拽調整功能?
Apr 04, 2025 pm 02:06 PM
前端開發中如何實現類似 VSCode 的面板拖拽調整功能?
Apr 04, 2025 pm 02:06 PM
探索前端中類似VSCode的面板拖拽調整功能的實現在前端開發中,如何實現類似於VSCode...
