在現今的資料環境中,企業遇到了許多不同的挑戰。其中之一是在所有消費者可用的統一和協調的數據層之上進行分析。這層可以為相同問題提供相同答案,而與所使用的方言或工具無關。
InterSystems IRIS 資料平台透過自適應分析附加功能來解決這個問題,該分析可以提供統一的語義層。 DevCommunity 中有很多關於透過 BI 工具使用它的文章。本文將介紹如何透過人工智慧使用它以及如何將一些見解帶回來。
讓我們一步一步來...
您可以在開發者社群網站輕鬆找到一些定義
簡而言之,它可以將結構化和統一形式的資料傳輸到您選擇的各種工具,以便進一步使用和分析。它為各種 BI 工具提供相同的資料結構。但是...它還可以向您的 AI/ML 工具提供相同的資料結構!
自適應分析有一個名為 AI-Link 的附加元件,它建構了從 AI 到 BI 的橋樑。
它是一個 Python 元件,旨在實現與語義層的程式設計交互,以簡化機器學習 (ML) 工作流程的關鍵階段(例如特徵工程)。
透過 AI-Link,您可以:
由於這是一個Python庫,因此可以在任何Python環境中使用。包括筆記本。
在本文中,我將給出一個在 AI-Link 的幫助下從 Jupyter Notebook 實現自適應分析解決方案的簡單範例。
這裡是 git 儲存庫,其中包含完整的 Notebook 作為範例:https://github.com/v23ent/aa-hands-on
後續步驟假設您已完成以下先決條件:
首先,讓我們在我們的環境中安裝所需的組件。這將下載進一步工作所需的一些軟體包。
'atscale' - 這是我們要連接的主要包
'prophet' - 我們需要進行預測的套件
pip install atscale prophet
然後我們需要導入代表語意層的一些關鍵概念的關鍵類別。
Client - 我們將用來建立與自適應分析的連接的類別;
Project - 代表自適應分析中的項目的類別;
DataModel - 代表我們的虛擬立方體的類別;
from atscale.client import Client
from atscale.data_model import DataModel
from atscale.project import Project
from prophet import Prophet
import pandas as pd
現在我們應該準備好建立與資料來源的連線。
client = Client(server='http://adaptive.analytics.server', username='sample')
client.connect()
繼續指定自適應分析實例的連線詳細資訊。一旦系統要求您提供組織,請在對話方塊中回應,然後輸入您在 AtScale 實例中的密碼。
建立連線後,您需要從伺服器上發布的項目清單中選擇您的項目。您將獲得項目清單作為互動式提示,答案應該是項目的整數 ID。然後,如果資料模型是唯一的,則會自動選擇它。
project = client.select_project()
data_model = project.select_data_model()
AI-Link元件庫中AtScale準備了很多方法。它們允許探索您擁有的數據目錄、查詢數據,甚至提取一些數據。 AtScale 文件包含廣泛的 API 參考,描述了所有可用的內容。
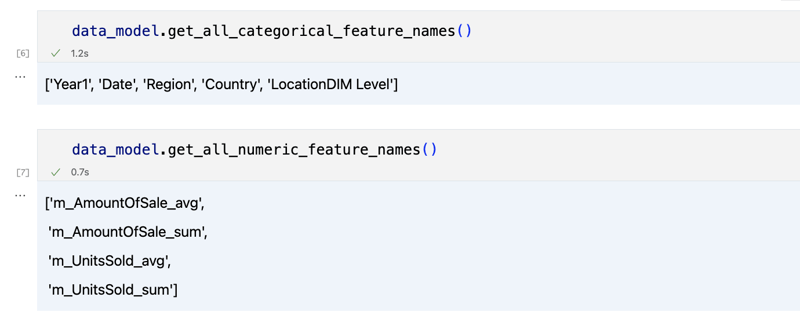
我們首先透過呼叫 data_model 的幾個方法來看看我們的資料集是什麼:
data_model.get_features()
data_model.get_all_categorical_feature_names()
data_model.get_all_numeric_feature_names()
輸出應如下圖

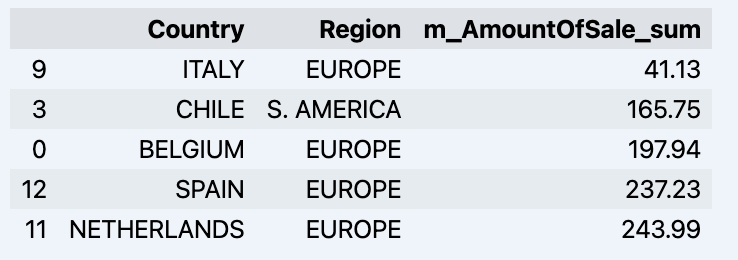
一旦我們環顧四周,我們就可以使用「get_data」方法來查詢我們感興趣的實際資料。它將傳回一個包含查詢結果的 pandas DataFrame。
df = data_model.get_data(feature_list = ['Country','Region','m_AmountOfSale_sum'])
df = df.sort_values(by='m_AmountOfSale_sum')
df.head()
這將顯示您的資料集:

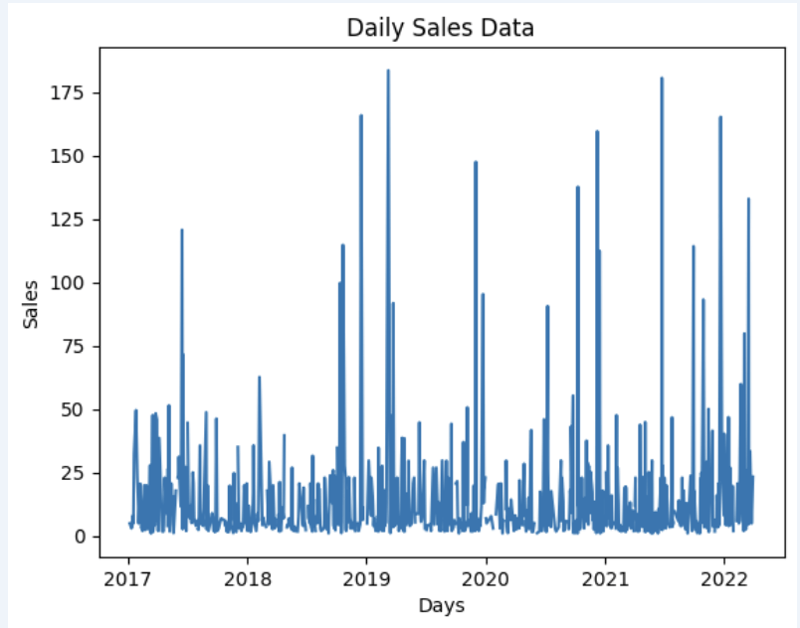
讓我們準備一些資料集並快速將其顯示在圖表上
import matplotlib.pyplot as plt

# We're taking sales for each date
dataframe = data_model.get_data(feature_list = ['Date','m_AmountOfSale_sum'])

# Create a line chart
plt.plot(dataframe['Date'], dataframe['m_AmountOfSale_sum'])

# Add labels and a title
plt.xlabel('Days')
plt.ylabel('Sales')
plt.title('Daily Sales Data')

# Display the chart
plt.show()
輸出:

The next step would be to actually get some value out of AI-Link bridge - let's do some simple prediction!
# Load the historical data to train the model
data_train = data_model.get_data(
    feature_list = ['Date','m_AmountOfSale_sum'],
    filter_less = {'Date':'2021-01-01'}
    )
data_test = data_model.get_data(
    feature_list = ['Date','m_AmountOfSale_sum'],
    filter_greater = {'Date':'2021-01-01'}
    )
We get 2 different datasets here: to train our model and to test it.
# For the tool we've chosen to do the prediction 'Prophet', we'll need to specify 2 columns: 'ds' and 'y'
data_train['ds'] = pd.to_datetime(data_train['Date'])
data_train.rename(columns={'m_AmountOfSale_sum': 'y'}, inplace=True)
data_test['ds'] = pd.to_datetime(data_test['Date'])
data_test.rename(columns={'m_AmountOfSale_sum': 'y'}, inplace=True)

# Initialize and fit the Prophet model
model = Prophet()
model.fit(data_train)
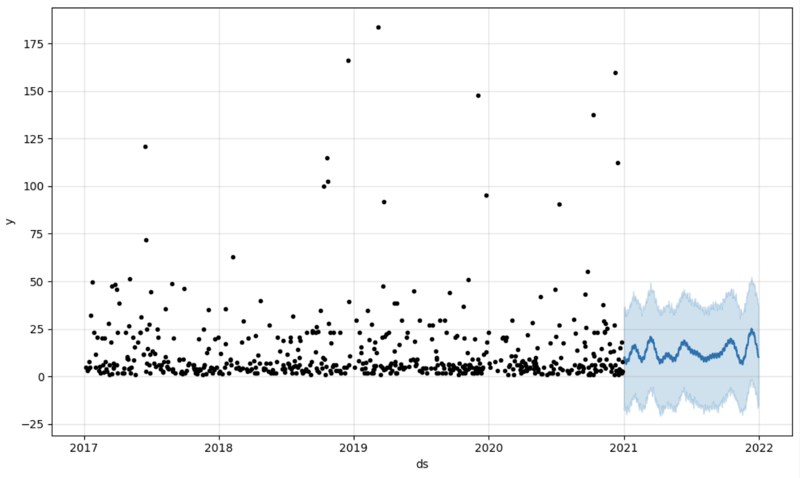
And then we create another dataframe to accomodate our prediction and display it on the graph
# Create a future dataframe for forecasting
future = pd.DataFrame()
future['ds'] = pd.date_range(start='2021-01-01', end='2021-12-31', freq='D')

# Make predictions
forecast = model.predict(future)
fig = model.plot(forecast)
fig.show()
Output:

Once we've got our prediction in place we can then put it back to the data warehouse and add an aggregate to our semantic model to reflect it for other consumers. The prediction would be available through any other BI tool for BI analysts and business users.
The prediction itself will be placed into our data warehouse and stored there.
from atscale.db.connections import Iris<br>
db = Iris(<br>
    username,<br>
    host,<br>
    namespace,<br>
    driver,<br>
    schema, <br>
    port=1972,<br>
    password=None, <br>
    warehouse_id=None<br>
    )

<p>data_model.writeback(dbconn=db,<br>
                    table_name= 'SalesPrediction',<br>
                    DataFrame = forecast)</p>

<p>data_model.create_aggregate_feature(dataset_name='SalesPrediction',<br>
                                    column_name='SalesForecasted',<br>
                                    name='sum_sales_forecasted',<br>
                                    aggregation_type='SUM')<br>
</p>That is it!
Good luck with your predictions!
以上是將 AI/ML 與您的自適應分析解決方案連接起來的詳細內容。更多資訊請關注PHP中文網其他相關文章!


