

嘗試使用 Snowflake (SiS) 中的 Streamlit 進行自然語言資料分析

介紹
Snowflake 發布了名為 Snowflake Copilot 的 LLM 助理功能作為預覽功能。使用 Snowflake Copilot,您可以使用自然語言分析表格資料。
另一方面,Snowflake (SiS) 中的 Streamlit 可讓您輕鬆整合生成式 AI 並安全地存取表格資料。這讓我思考:我們是否可以創造一個更主動的自然語言資料分析工具?因此,我開發了一個可以使用自然語言分析和視覺化資料的應用程式。
註:本文僅代表個人觀點,不代表Snowflake。
功能概述
目標
- 可供不熟悉 SQL 的業務使用者使用
- 能夠透過滑鼠操作選擇資料庫/模式/表進行分析
- 能夠分析非常模糊的自然語言查詢
實際截圖(節錄)
以下是使用 Cortex LLM (snowflake-arctic) 的分析結果摘錄。
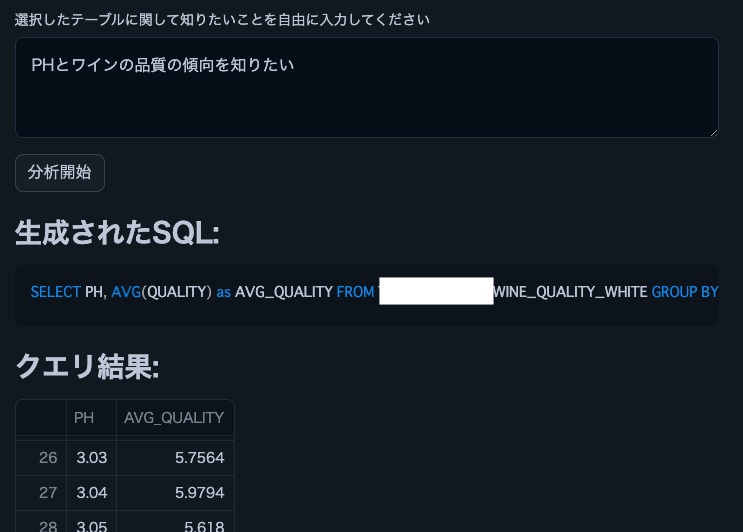

注意:我們使用了這個葡萄酒品質資料集。
功能列表
- 選擇 Cortex LLM 進行分析
- 選擇資料庫/模式/表格進行分析
- 顯示所選表格的列資訊和樣本資料
- 使用使用者的自然語言輸入進行分析
- 自動產生 SQL 進行分析
- 自動執行產生的SQL
- SQL查詢執行結果的顯示
- Cortex LLM 提供的資料洞察
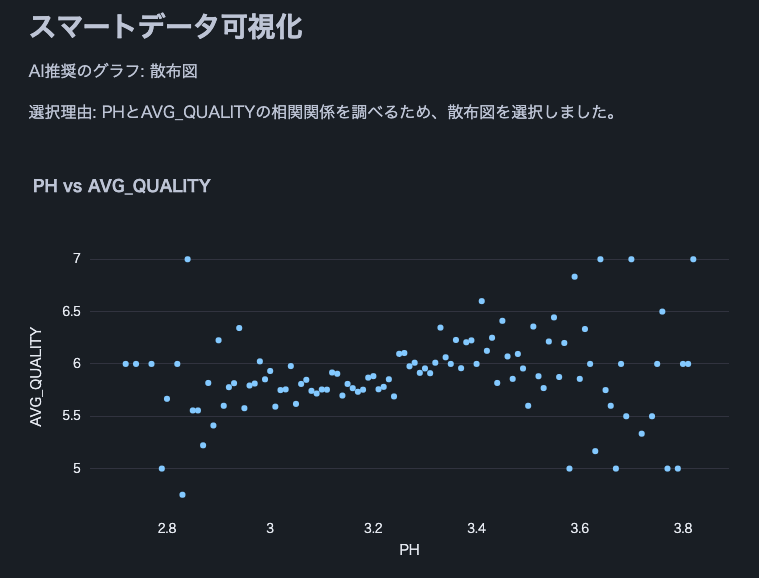
- 資料視覺化
- Cortex LLM 進行適當的圖表選擇和顯示
- Cortex LLM 的最終數據解釋
操作條件
- 可存取 Cortex LLM 的 Snowflake 帳戶
- snowflake-ml-python 1.1.2 或更高版本
防範措施
- 使用大型資料集時要小心,因為沒有設定資料限制
- 產生的 SQL 查詢的大型結果集可能需要一些時間來處理
- 大型結果集可能會導致 LLM 令牌限制錯誤
原始碼
from snowflake.snowpark.context import get_active_session
import streamlit as st
from snowflake.cortex import Complete as CompleteText
import snowflake.snowpark.functions as F
import pandas as pd
import numpy as np
import json
import plotly.express as px

# Get current session
session = get_active_session()

# Application title
st.title("Natural Language Data Analysis App")

# Cortex LLM settings
st.sidebar.title("Cortex LLM Settings")
lang_model = st.sidebar.radio("Select the language model you want to use",
                              ("snowflake-arctic", "reka-flash", "reka-core",
                               "mistral-large2", "mistral-large", "mixtral-8x7b", "mistral-7b",
                               "llama3.1-405b", "llama3.1-70b", "llama3.1-8b",
                               "llama3-70b", "llama3-8b", "llama2-70b-chat",
                               "jamba-instruct", "gemma-7b")
)

# Function to escape column names
def escape_column_name(name):
    return f'"{name}"'

# Function to get table information
def get_table_info(database, schema, table):
    # Get column information
    columns = session.sql(f"DESCRIBE TABLE {database}.{schema}.{table}").collect()

    # Create DataFrame
    column_df = pd.DataFrame(columns)

    # Get row count
    row_count = session.sql(f"SELECT COUNT(*) as count FROM {database}.{schema}.{table}").collect()[0]['COUNT']

    # Get sample data
    sample_data = session.sql(f"SELECT * FROM {database}.{schema}.{table} LIMIT 5").collect()
    sample_df = pd.DataFrame(sample_data)

    return column_df, row_count, sample_df

# Data analysis function
def analyze(df, query):
    st.subheader("Result Analysis")

    # Display basic statistical information
    st.subheader("Basic Statistics")
    st.write(df.describe())

    # Use AI for data analysis
    analysis_prompt = f"""
    Based on the following dataframe and original question, please perform data analysis.
    Concisely explain in English the insights, trends, and anomalies derived from the data.
    If possible, please also mention the following points:
    1. Data distribution and characteristics
    2. Presence of abnormal values or outliers
    3. Correlations between columns (if there are multiple numeric columns)
    4. Time-series trends (if there is date or time data)
    5. Category-specific features (if data can be divided by categories)

    Dataframe:
    {df.to_string()}

    Original question:
    {query}
    """

    analysis = CompleteText(lang_model, analysis_prompt)
    st.write(analysis)

# Data visualization function
def smart_data_visualization(df):
    st.subheader("Smart Data Visualization")

    if df.empty:
        st.warning("The dataframe is empty. There is no data to visualize.")
        return

    # Request AI for graph suggestion
    columns_info = "\n".join([f"{col} - type: {df[col].dtype}" for col in df.columns])
    sample_data = df.head().to_string()

    visualization_prompt = f"""
    Analyze the information of the following dataframe and suggest the most appropriate graph type and the columns to use for its x-axis and y-axis.
    Consider the characteristics of the data to ensure a meaningful visualization.

    Column information:
    {columns_info}

    Sample data:
    {sample_data}

    Please provide only the following JSON data format as your response:
    {{
        "graph_type": "One of: scatter plot, bar chart, line chart, histogram, box plot",
        "x_axis": "Column name to use for x-axis",
        "y_axis": "Column name to use for y-axis (if applicable)",
        "explanation": "Brief explanation of the selection reason"
    }}
    """

    ai_suggestion = CompleteText(lang_model, visualization_prompt)

    try:
        suggestion = json.loads(ai_suggestion)
        graph_type = suggestion['graph_type']
        x_axis = suggestion['x_axis']
        y_axis = suggestion.get('y_axis')  # y-axis might not be needed in some cases
        explanation = suggestion['explanation']

        st.write(f"AI recommended graph: {graph_type}")
        st.write(f"Selection reason: {explanation}")

        if graph_type == "scatter plot":
            fig = px.scatter(df, x=x_axis, y=y_axis, title=f"{x_axis} vs {y_axis}")
        elif graph_type == "bar chart":
            fig = px.bar(df, x=x_axis, y=y_axis, title=f"{y_axis} by {x_axis}")
        elif graph_type == "line chart":
            fig = px.line(df, x=x_axis, y=y_axis, title=f"{y_axis} over {x_axis}")
        elif graph_type == "histogram":
            fig = px.histogram(df, x=x_axis, title=f"Distribution of {x_axis}")
        elif graph_type == "box plot":
            fig = px.box(df, x=x_axis, y=y_axis, title=f"Distribution of {y_axis} by {x_axis}")
        else:
            st.warning(f"Unsupported graph type: {graph_type}")
            return

        st.plotly_chart(fig)

    except json.JSONDecodeError:
        st.error("Failed to parse AI suggestion. Please try again.")
    except KeyError as e:
        st.error(f"AI suggestion is missing necessary information: {str(e)}")
    except Exception as e:
        st.error(f"An error occurred while creating the graph: {str(e)}")

    # AI interpretation of visualization
    visualization_interpretation_prompt = f"""
    Based on the following dataset and created graph, please provide a detailed interpretation of the data trends and characteristics in English.
    Point out possible insights, patterns, anomalies, or areas that require additional analysis.

    Dataset information:
    Columns: {', '.join(df.columns)}
    Number of rows: {len(df)}

    Created graph:
    Type: {graph_type}
    X-axis: {x_axis}
    Y-axis: {y_axis if y_axis else 'None'}
    """

    ai_interpretation = CompleteText(lang_model, visualization_interpretation_prompt)
    st.subheader("AI Interpretation of the Graph")
    st.write(ai_interpretation)

# Function to handle cases where AI response is not just SQL query
def clean_sql_query(query):
    # Remove leading and trailing whitespace
    query = query.strip()
    # If not starting with SQL keywords, remove everything up to the first SELECT
    if not query.upper().startswith(('SELECT')):
        keywords = ['SELECT']
        for keyword in keywords:
            if keyword in query.upper():
                query = query[query.upper().index(keyword):]
                break
    return query

# Function for natural language querying of DB
def data_analysis_and_natural_language_query():
    # Database selection
    databases = session.sql("SHOW DATABASES").collect()
    database_names = [row['name'] for row in databases]
    selected_database = st.selectbox("Select a database", database_names)

    if selected_database:
        # Schema selection
        schemas = session.sql(f"SHOW SCHEMAS IN DATABASE {selected_database}").collect()
        schema_names = [row['name'] for row in schemas]
        selected_schema = st.selectbox("Select a schema", schema_names)

        if selected_schema:
            # Table selection
            tables = session.sql(f"SHOW TABLES IN {selected_database}.{selected_schema}").collect()
            table_names = [row['name'] for row in tables]
            selected_table = st.selectbox("Select a table", table_names)

            if selected_table:
                # Get table information
                column_df, row_count, sample_df = get_table_info(selected_database, selected_schema, selected_table)

                st.subheader("Table Information")
                st.write(f"Table name: `{selected_database}.{selected_schema}.{selected_table}`")
                st.write(f"Total rows: **{row_count:,}**")

                st.subheader("Column Information")
                st.dataframe(column_df)

                st.subheader("Sample Data (showing only 5 rows)")
                st.dataframe(sample_df)

                # Stringify table information (for AI)
                table_info = f"""
                Table name: {selected_database}.{selected_schema}.{selected_table}
                Total rows: {row_count}

                Column information:
                {column_df.to_string(index=False)}
                Sample data:
                {sample_df.to_string(index=False)}
                """

                # Natural language input from user
                user_query = st.text_area("Enter what you want to know about the selected table")

                if st.button("Start Analysis"):
                    if user_query:
                        # Use AI to generate SQL
                        prompt = f"""
                        Based on the following table information and question, please generate an appropriate SQL query.
                        Return only the generated SQL query without any additional response.

                        Table information:
                        {table_info}

                        Question: {user_query}

                        Notes:
                        - Follow Snowflake SQL syntax.
                        - Use aggregate functions to keep the query result size manageable.
                        - Use {selected_database}.{selected_schema}.{selected_table} as the table name.
                        """

                        generated_sql = CompleteText(lang_model, prompt)
                        generated_sql = clean_sql_query(generated_sql)
                        st.subheader("Generated SQL:")
                        st.code(generated_sql, language='sql')

                        try:
                            # Execute the generated SQL
                            result = session.sql(generated_sql).collect()
                            df = pd.DataFrame(result)

                            st.subheader("Query Result:")
                            st.dataframe(df)

                            # Analyze results
                            analyze(df, user_query)

                            # Smart data visualization
                            smart_data_visualization(df)

                        except Exception as e:
                            st.error(f"An error occurred while executing the query: {str(e)}")
                    else:
                        st.warning("Please enter a question.")

# Execution part
data_analysis_and_natural_language_query()
結論
無需 SQL 或 Python 知識即可使用自然語言輕鬆分析表格資料的能力可以顯著拓寬企業中業務使用者的資料利用範圍。透過新增連接多個表格或增加視覺化圖表的種類等功能,甚至可以執行更複雜的分析。我鼓勵大家嘗試使用 Snowflake 中的 Streamlit 來實現資料分析民主化。
公告
Snowflake 最新動態 X 更新
我正在分享 Snowflake 在 X 上的最新動態。如果您有興趣,請隨時關注!
英文版
雪花新鮮事機器人(英文版)
https://x.com/snow_new_en
日文版
雪花What's New Bot(日文版)
https://x.com/snow_new_jp
變更歷史記錄
(20240914) 初始貼文
日本原創文章
https://zenn.dev/tsubasa_tech/articles/2608c820294860
以上是嘗試使用 Snowflake (SiS) 中的 Streamlit 進行自然語言資料分析的詳細內容。更多資訊請關注PHP中文網其他相關文章!

熱AI工具

Undresser.AI Undress
人工智慧驅動的應用程序,用於創建逼真的裸體照片

AI Clothes Remover
用於從照片中去除衣服的線上人工智慧工具。

Undress AI Tool
免費脫衣圖片

Clothoff.io
AI脫衣器

Video Face Swap
使用我們完全免費的人工智慧換臉工具,輕鬆在任何影片中換臉!

熱門文章
熱工具

記事本++7.3.1
好用且免費的程式碼編輯器

SublimeText3漢化版
中文版,非常好用

禪工作室 13.0.1
強大的PHP整合開發環境

Dreamweaver CS6
視覺化網頁開發工具

SublimeText3 Mac版
神級程式碼編輯軟體(SublimeText3)


 Python與C:學習曲線和易用性
Apr 19, 2025 am 12:20 AM
Python與C:學習曲線和易用性
Apr 19, 2025 am 12:20 AM
Python更易學且易用,C 則更強大但複雜。 1.Python語法簡潔,適合初學者,動態類型和自動內存管理使其易用,但可能導致運行時錯誤。 2.C 提供低級控制和高級特性,適合高性能應用,但學習門檻高,需手動管理內存和類型安全。
 學習Python:2小時的每日學習是否足夠?
Apr 18, 2025 am 12:22 AM
學習Python:2小時的每日學習是否足夠?
Apr 18, 2025 am 12:22 AM
每天學習Python兩個小時是否足夠?這取決於你的目標和學習方法。 1)制定清晰的學習計劃,2)選擇合適的學習資源和方法,3)動手實踐和復習鞏固,可以在這段時間內逐步掌握Python的基本知識和高級功能。
 Python vs.C:探索性能和效率
Apr 18, 2025 am 12:20 AM
Python vs.C:探索性能和效率
Apr 18, 2025 am 12:20 AM
Python在開發效率上優於C ,但C 在執行性能上更高。 1.Python的簡潔語法和豐富庫提高開發效率。 2.C 的編譯型特性和硬件控制提升執行性能。選擇時需根據項目需求權衡開發速度與執行效率。
 Python vs. C:了解關鍵差異
Apr 21, 2025 am 12:18 AM
Python vs. C:了解關鍵差異
Apr 21, 2025 am 12:18 AM
Python和C 各有優勢,選擇應基於項目需求。 1)Python適合快速開發和數據處理,因其簡潔語法和動態類型。 2)C 適用於高性能和系統編程,因其靜態類型和手動內存管理。
 Python標準庫的哪一部分是:列表或數組?
Apr 27, 2025 am 12:03 AM
Python標準庫的哪一部分是:列表或數組?
Apr 27, 2025 am 12:03 AM
pythonlistsarepartofthestAndArdLibrary,herilearRaysarenot.listsarebuilt-In,多功能,和Rused ForStoringCollections,而EasaraySaraySaraySaraysaraySaraySaraysaraySaraysarrayModuleandleandleandlesscommonlyusedDduetolimitedFunctionalityFunctionalityFunctionality。
 Python:自動化,腳本和任務管理
Apr 16, 2025 am 12:14 AM
Python:自動化,腳本和任務管理
Apr 16, 2025 am 12:14 AM
Python在自動化、腳本編寫和任務管理中表現出色。 1)自動化:通過標準庫如os、shutil實現文件備份。 2)腳本編寫:使用psutil庫監控系統資源。 3)任務管理:利用schedule庫調度任務。 Python的易用性和豐富庫支持使其在這些領域中成為首選工具。
 科學計算的Python:詳細的外觀
Apr 19, 2025 am 12:15 AM
科學計算的Python:詳細的外觀
Apr 19, 2025 am 12:15 AM
Python在科學計算中的應用包括數據分析、機器學習、數值模擬和可視化。 1.Numpy提供高效的多維數組和數學函數。 2.SciPy擴展Numpy功能,提供優化和線性代數工具。 3.Pandas用於數據處理和分析。 4.Matplotlib用於生成各種圖表和可視化結果。
 Web開發的Python:關鍵應用程序
Apr 18, 2025 am 12:20 AM
Web開發的Python:關鍵應用程序
Apr 18, 2025 am 12:20 AM
Python在Web開發中的關鍵應用包括使用Django和Flask框架、API開發、數據分析與可視化、機器學習與AI、以及性能優化。 1.Django和Flask框架:Django適合快速開發複雜應用,Flask適用於小型或高度自定義項目。 2.API開發:使用Flask或DjangoRESTFramework構建RESTfulAPI。 3.數據分析與可視化:利用Python處理數據並通過Web界面展示。 4.機器學習與AI:Python用於構建智能Web應用。 5.性能優化:通過異步編程、緩存和代碼優
