
Snowflake 發布了名為 Snowflake Copilot 的 LLM 助理功能作為預覽功能。使用 Snowflake Copilot,您可以使用自然語言分析表格資料。
另一方面,Snowflake (SiS) 中的 Streamlit 可讓您輕鬆整合生成式 AI 並安全地存取表格資料。這讓我思考:我們是否可以創造一個更主動的自然語言資料分析工具?因此,我開發了一個可以使用自然語言分析和視覺化資料的應用程式。
註:本文僅代表個人觀點,不代表Snowflake。
以下是使用 Cortex LLM (snowflake-arctic) 的分析結果摘錄。

注意:我們使用了這個葡萄酒品質資料集。
from snowflake.snowpark.context import get_active_session
import streamlit as st
from snowflake.cortex import Complete as CompleteText
import snowflake.snowpark.functions as F
import pandas as pd
import numpy as np
import json
import plotly.express as px
# Get current session
session = get_active_session()
# Application title
st.title("Natural Language Data Analysis App")
# Cortex LLM settings
st.sidebar.title("Cortex LLM Settings")
lang_model = st.sidebar.radio("Select the language model you want to use",
("snowflake-arctic", "reka-flash", "reka-core",
"mistral-large2", "mistral-large", "mixtral-8x7b", "mistral-7b",
"llama3.1-405b", "llama3.1-70b", "llama3.1-8b",
"llama3-70b", "llama3-8b", "llama2-70b-chat",
"jamba-instruct", "gemma-7b")
)
# Function to escape column names
def escape_column_name(name):
return f'"{name}"'
# Function to get table information
def get_table_info(database, schema, table):
# Get column information
columns = session.sql(f"DESCRIBE TABLE {database}.{schema}.{table}").collect()
# Create DataFrame
column_df = pd.DataFrame(columns)
# Get row count
row_count = session.sql(f"SELECT COUNT(*) as count FROM {database}.{schema}.{table}").collect()[0]['COUNT']
# Get sample data
sample_data = session.sql(f"SELECT * FROM {database}.{schema}.{table} LIMIT 5").collect()
sample_df = pd.DataFrame(sample_data)
return column_df, row_count, sample_df
# Data analysis function
def analyze(df, query):
st.subheader("Result Analysis")
# Display basic statistical information
st.subheader("Basic Statistics")
st.write(df.describe())
# Use AI for data analysis
analysis_prompt = f"""
Based on the following dataframe and original question, please perform data analysis.
Concisely explain in English the insights, trends, and anomalies derived from the data.
If possible, please also mention the following points:
1. Data distribution and characteristics
2. Presence of abnormal values or outliers
3. Correlations between columns (if there are multiple numeric columns)
4. Time-series trends (if there is date or time data)
5. Category-specific features (if data can be divided by categories)
Dataframe:
{df.to_string()}
Original question:
{query}
"""
analysis = CompleteText(lang_model, analysis_prompt)
st.write(analysis)
# Data visualization function
def smart_data_visualization(df):
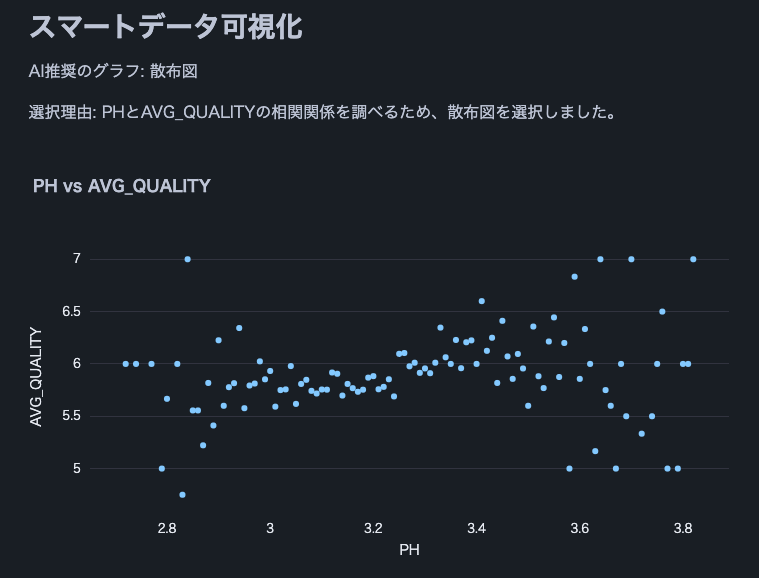
st.subheader("Smart Data Visualization")
if df.empty:
st.warning("The dataframe is empty. There is no data to visualize.")
return
# Request AI for graph suggestion
columns_info = "\n".join([f"{col} - type: {df[col].dtype}" for col in df.columns])
sample_data = df.head().to_string()
visualization_prompt = f"""
Analyze the information of the following dataframe and suggest the most appropriate graph type and the columns to use for its x-axis and y-axis.
Consider the characteristics of the data to ensure a meaningful visualization.
Column information:
{columns_info}
Sample data:
{sample_data}
Please provide only the following JSON data format as your response:
{{
"graph_type": "One of: scatter plot, bar chart, line chart, histogram, box plot",
"x_axis": "Column name to use for x-axis",
"y_axis": "Column name to use for y-axis (if applicable)",
"explanation": "Brief explanation of the selection reason"
}}
"""
ai_suggestion = CompleteText(lang_model, visualization_prompt)
try:
suggestion = json.loads(ai_suggestion)
graph_type = suggestion['graph_type']
x_axis = suggestion['x_axis']
y_axis = suggestion.get('y_axis') # y-axis might not be needed in some cases
explanation = suggestion['explanation']
st.write(f"AI recommended graph: {graph_type}")
st.write(f"Selection reason: {explanation}")
if graph_type == "scatter plot":
fig = px.scatter(df, x=x_axis, y=y_axis, title=f"{x_axis} vs {y_axis}")
elif graph_type == "bar chart":
fig = px.bar(df, x=x_axis, y=y_axis, title=f"{y_axis} by {x_axis}")
elif graph_type == "line chart":
fig = px.line(df, x=x_axis, y=y_axis, title=f"{y_axis} over {x_axis}")
elif graph_type == "histogram":
fig = px.histogram(df, x=x_axis, title=f"Distribution of {x_axis}")
elif graph_type == "box plot":
fig = px.box(df, x=x_axis, y=y_axis, title=f"Distribution of {y_axis} by {x_axis}")
else:
st.warning(f"Unsupported graph type: {graph_type}")
return
st.plotly_chart(fig)
except json.JSONDecodeError:
st.error("Failed to parse AI suggestion. Please try again.")
except KeyError as e:
st.error(f"AI suggestion is missing necessary information: {str(e)}")
except Exception as e:
st.error(f"An error occurred while creating the graph: {str(e)}")
# AI interpretation of visualization
visualization_interpretation_prompt = f"""
Based on the following dataset and created graph, please provide a detailed interpretation of the data trends and characteristics in English.
Point out possible insights, patterns, anomalies, or areas that require additional analysis.
Dataset information:
Columns: {', '.join(df.columns)}
Number of rows: {len(df)}
Created graph:
Type: {graph_type}
X-axis: {x_axis}
Y-axis: {y_axis if y_axis else 'None'}
"""
ai_interpretation = CompleteText(lang_model, visualization_interpretation_prompt)
st.subheader("AI Interpretation of the Graph")
st.write(ai_interpretation)
# Function to handle cases where AI response is not just SQL query
def clean_sql_query(query):
# Remove leading and trailing whitespace
query = query.strip()
# If not starting with SQL keywords, remove everything up to the first SELECT
if not query.upper().startswith(('SELECT')):
keywords = ['SELECT']
for keyword in keywords:
if keyword in query.upper():
query = query[query.upper().index(keyword):]
break
return query
# Function for natural language querying of DB
def data_analysis_and_natural_language_query():
# Database selection
databases = session.sql("SHOW DATABASES").collect()
database_names = [row['name'] for row in databases]
selected_database = st.selectbox("Select a database", database_names)
if selected_database:
# Schema selection
schemas = session.sql(f"SHOW SCHEMAS IN DATABASE {selected_database}").collect()
schema_names = [row['name'] for row in schemas]
selected_schema = st.selectbox("Select a schema", schema_names)
if selected_schema:
# Table selection
tables = session.sql(f"SHOW TABLES IN {selected_database}.{selected_schema}").collect()
table_names = [row['name'] for row in tables]
selected_table = st.selectbox("Select a table", table_names)
if selected_table:
# Get table information
column_df, row_count, sample_df = get_table_info(selected_database, selected_schema, selected_table)
st.subheader("Table Information")
st.write(f"Table name: `{selected_database}.{selected_schema}.{selected_table}`")
st.write(f"Total rows: **{row_count:,}**")
st.subheader("Column Information")
st.dataframe(column_df)
st.subheader("Sample Data (showing only 5 rows)")
st.dataframe(sample_df)
# Stringify table information (for AI)
table_info = f"""
Table name: {selected_database}.{selected_schema}.{selected_table}
Total rows: {row_count}
Column information:
{column_df.to_string(index=False)}
Sample data:
{sample_df.to_string(index=False)}
"""
# Natural language input from user
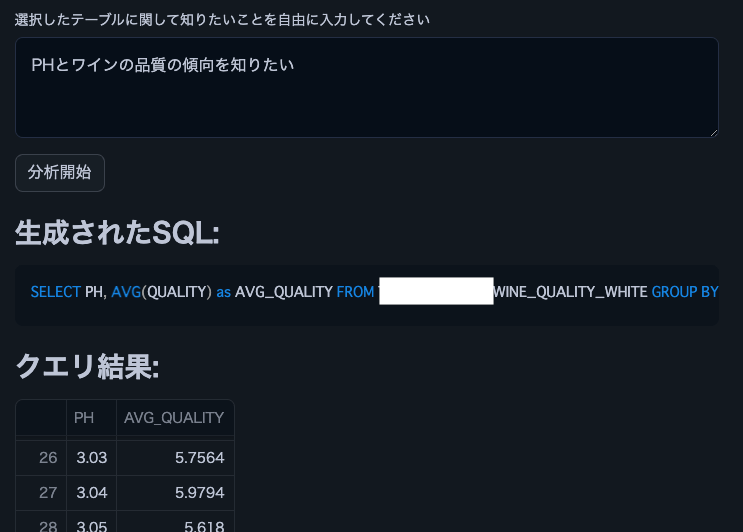
user_query = st.text_area("Enter what you want to know about the selected table")
if st.button("Start Analysis"):
if user_query:
# Use AI to generate SQL
prompt = f"""
Based on the following table information and question, please generate an appropriate SQL query.
Return only the generated SQL query without any additional response.
Table information:
{table_info}
Question: {user_query}
Notes:
- Follow Snowflake SQL syntax.
- Use aggregate functions to keep the query result size manageable.
- Use {selected_database}.{selected_schema}.{selected_table} as the table name.
"""
generated_sql = CompleteText(lang_model, prompt)
generated_sql = clean_sql_query(generated_sql)
st.subheader("Generated SQL:")
st.code(generated_sql, language='sql')
try:
# Execute the generated SQL
result = session.sql(generated_sql).collect()
df = pd.DataFrame(result)
st.subheader("Query Result:")
st.dataframe(df)
# Analyze results
analyze(df, user_query)
# Smart data visualization
smart_data_visualization(df)
except Exception as e:
st.error(f"An error occurred while executing the query: {str(e)}")
else:
st.warning("Please enter a question.")
# Execution part
data_analysis_and_natural_language_query()
無需 SQL 或 Python 知識即可使用自然語言輕鬆分析表格資料的能力可以顯著拓寬企業中業務使用者的資料利用範圍。透過新增連接多個表格或增加視覺化圖表的種類等功能,甚至可以執行更複雜的分析。我鼓勵大家嘗試使用 Snowflake 中的 Streamlit 來實現資料分析民主化。
我正在分享 Snowflake 在 X 上的最新動態。如果您有興趣,請隨時關注!
雪花新鮮事機器人(英文版)
https://x.com/snow_new_en
雪花What's New Bot(日文版)
https://x.com/snow_new_jp
(20240914) 初始貼文
https://zenn.dev/tsubasa_tech/articles/2608c820294860
以上是嘗試使用 Snowflake (SiS) 中的 Streamlit 進行自然語言資料分析的詳細內容。更多資訊請關注PHP中文網其他相關文章!


