

使用 Scikit-Learn 完成機器學習工作流程:預測加州房價

介紹
在本文中,我們將使用 Scikit-Learn 來示範完整的機器學習專案工作流程。我們將建立一個模型,根據各種特徵(例如收入中位數、房屋年齡和平均房間數量)來預測加州的房價。該專案將指導您完成流程的每個步驟,包括資料載入、探索、模型訓練、評估和結果視覺化。無論您是想要了解基礎知識的初學者,還是想要複習知識的經驗豐富的從業者,本文都將為機器學習技術的實際應用提供寶貴的見解。
加州房價預測項目
一、簡介
加州房地產市場以其獨特的特徵和定價動態而聞名。在這個專案中,我們的目標是開發一種機器學習模型來根據各種特徵預測房價。我們將使用加州住房資料集,其中包括各種屬性,例如收入中位數、房屋年齡、平均房間等。
2. 導入庫
在本節中,我們將匯入資料操作、視覺化和建立機器學習模型所需的函式庫。
import pandas as pd
import matplotlib.pyplot as plt
from sklearn.model_selection import train_test_split
from sklearn.linear_model import LinearRegression
from sklearn.metrics import mean_squared_error
from sklearn.datasets import fetch_california_housing
3. 載入資料集
我們將載入加州住房資料集並建立一個 DataFrame 來組織資料。目標變量,即房價,將作為新列添加。
# Load the California Housing dataset
california = fetch_california_housing()
df = pd.DataFrame(california.data, columns=california.feature_names)
df['PRICE'] = california.target
4. 隨機選擇樣本
為了保持分析的可管理性,我們將從資料集中隨機選擇 700 個樣本進行研究。
# Randomly Selecting 700 Samples
df_sample = df.sample(n=700, random_state=42)
5.查看我們的數據
本節將提供資料集的概述,顯示前五行以了解資料的特徵和結構。
# Overview of the data
print("First five rows of the dataset:")
print(df_sample.head())
輸出
First five rows of the dataset:
       MedInc  HouseAge  AveRooms  AveBedrms  Population  AveOccup  Latitude  \
20046  1.6812      25.0  4.192201   1.022284      1392.0  3.877437     36.06
3024   2.5313      30.0  5.039384   1.193493      1565.0  2.679795     35.14
15663  3.4801      52.0  3.977155   1.185877      1310.0  1.360332     37.80
20484  5.7376      17.0  6.163636   1.020202      1705.0  3.444444     34.28
9814   3.7250      34.0  5.492991   1.028037      1063.0  2.483645     36.62

       Longitude    PRICE
20046    -119.01  0.47700
3024     -119.46  0.45800
15663    -122.44  5.00001
20484    -118.72  2.18600
9814     -121.93  2.78000
顯示資料框訊息
print(df_sample.info())
輸出
<class 'pandas.core.frame.DataFrame'>
Index: 700 entries, 20046 to 5350
Data columns (total 9 columns):
 #   Column      Non-Null Count  Dtype
---  ------      --------------  -----
 0   MedInc      700 non-null    float64
 1   HouseAge    700 non-null    float64
 2   AveRooms    700 non-null    float64
 3   AveBedrms   700 non-null    float64
 4   Population  700 non-null    float64
 5   AveOccup    700 non-null    float64
 6   Latitude    700 non-null    float64
 7   Longitude   700 non-null    float64
 8   PRICE       700 non-null    float64
dtypes: float64(9)
memory usage: 54.7 KB
顯示摘要統計數據
print(df_sample.describe())
輸出
           MedInc    HouseAge    AveRooms   AveBedrms   Population  \
count  700.000000  700.000000  700.000000  700.000000   700.000000
mean     3.937653   28.855714    5.404192    1.079266  1387.422857
std      2.085831   12.353313    1.848898    0.236318  1027.873659
min      0.852700    2.000000    2.096692    0.500000     8.000000
25%      2.576350   18.000000    4.397751    1.005934   781.000000
50%      3.480000   30.000000    5.145295    1.047086  1159.500000
75%      4.794625   37.000000    6.098061    1.098656  1666.500000
max     15.000100   52.000000   36.075472    5.273585  8652.000000

         AveOccup    Latitude   Longitude       PRICE
count  700.000000  700.000000  700.000000  700.000000
mean     2.939913   35.498243 -119.439729    2.082073
std      0.745525    2.123689    1.956998    1.157855
min      1.312994   32.590000 -124.150000    0.458000
25%      2.457560   33.930000 -121.497500    1.218500
50%      2.834524   34.190000 -118.420000    1.799000
75%      3.326869   37.592500 -118.007500    2.665500
max      7.200000   41.790000 -114.590000    5.000010
6. 將資料集拆分為訓練集和測試集
我們將資料集分為特徵(X)和目標變數(y),然後將其分為訓練集和測試集,用於模型訓練和評估。
# Splitting the dataset into Train and Test sets
X = df_sample.drop('PRICE', axis=1)  # Features
y = df_sample['PRICE']  # Target variable

# Split the dataset into training and testing sets
X_train, X_test, y_train, y_test = train_test_split(X, y, test_size=0.2, random_state=42)
7. 模型訓練
在本節中,我們將使用訓練資料建立和訓練線性迴歸模型,以了解特徵與房價之間的關係。
# Creating and training the Linear Regression model
lr = LinearRegression()
lr.fit(X_train, y_train)
8. 評估模型
我們將對測試集進行預測,並計算均方誤差 (MSE) 和 R 平方值來評估模型的效能。
# Making predictions on the test set
y_pred = lr.predict(X_test)

# Calculating Mean Squared Error
mse = mean_squared_error(y_test, y_pred)
print(f"\nLinear Regression Mean Squared Error: {mse}")
輸出
Linear Regression Mean Squared Error: 0.3699851092128846
9. 顯示實際值與預測值
在這裡,我們將建立一個 DataFrame 來比較實際房價與模型產生的預測價格。
# Displaying Actual vs Predicted Values
results = pd.DataFrame({'Actual Prices': y_test.values, 'Predicted Prices': y_pred})
print("\nActual vs Predicted:")
print(results)
輸出
Actual vs Predicted:
     Actual Prices  Predicted Prices
0          0.87500          0.887202
1          1.19400          2.445412
2          5.00001          6.249122
3          2.78700          2.743305
4          1.99300          2.794774
..             ...               ...
135        1.62100          2.246041
136        3.52500          2.626354
137        1.91700          1.899090
138        2.27900          2.731436
139        1.73400          2.017134

[140 rows x

 2 columns]
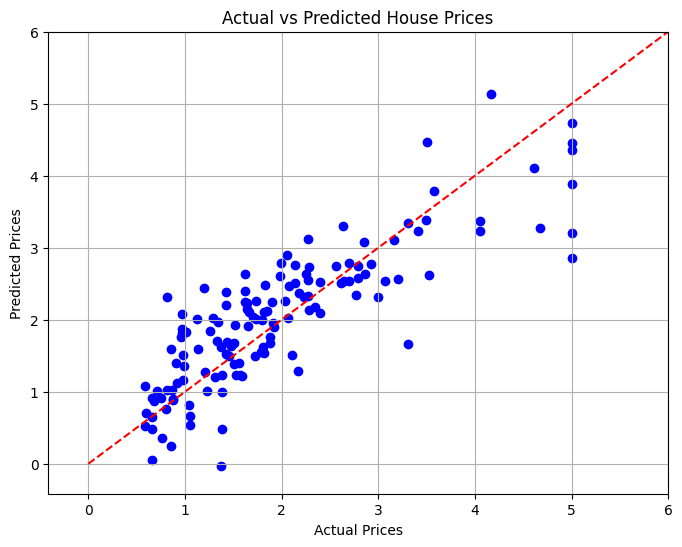
10. 可視化結果
在最後一部分,我們將使用散點圖視覺化實際房價和預測房價之間的關係,以直觀地評估模型的性能。
# Visualizing the Results
plt.figure(figsize=(8, 6))
plt.scatter(y_test, y_pred, color='blue')
plt.xlabel('Actual Prices')
plt.ylabel('Predicted Prices')
plt.title('Actual vs Predicted House Prices')

# Draw the ideal line
plt.plot([0, 6], [0, 6], color='red', linestyle='--')

# Set limits to minimize empty space
plt.xlim(y_test.min() - 1, y_test.max() + 1)
plt.ylim(y_test.min() - 1, y_test.max() + 1)

plt.grid()
plt.show()
結論
在這個專案中,我們開發了一個線性迴歸模型來根據各種特徵預測加州的房價。計算均方誤差來評估模型的性能,從而提供預測準確性的定量測量。透過視覺化,我們能夠看到我們的模型相對於實際值的表現如何。
該專案展示了機器學習在房地產分析中的強大功能,可以作為更先進的預測建模技術的基礎。
以上是使用 Scikit-Learn 完成機器學習工作流程:預測加州房價的詳細內容。更多資訊請關注PHP中文網其他相關文章!

熱AI工具

Undresser.AI Undress
人工智慧驅動的應用程序,用於創建逼真的裸體照片

AI Clothes Remover
用於從照片中去除衣服的線上人工智慧工具。

Undress AI Tool
免費脫衣圖片

Clothoff.io
AI脫衣器

Video Face Swap
使用我們完全免費的人工智慧換臉工具,輕鬆在任何影片中換臉!

熱門文章
熱工具

記事本++7.3.1
好用且免費的程式碼編輯器

SublimeText3漢化版
中文版,非常好用

禪工作室 13.0.1
強大的PHP整合開發環境

Dreamweaver CS6
視覺化網頁開發工具

SublimeText3 Mac版
神級程式碼編輯軟體(SublimeText3)


 Python vs.C:申請和用例
Apr 12, 2025 am 12:01 AM
Python vs.C:申請和用例
Apr 12, 2025 am 12:01 AM
Python适合数据科学、Web开发和自动化任务,而C 适用于系统编程、游戏开发和嵌入式系统。Python以简洁和强大的生态系统著称,C 则以高性能和底层控制能力闻名。
 Python:遊戲,Guis等
Apr 13, 2025 am 12:14 AM
Python:遊戲,Guis等
Apr 13, 2025 am 12:14 AM
Python在遊戲和GUI開發中表現出色。 1)遊戲開發使用Pygame,提供繪圖、音頻等功能,適合創建2D遊戲。 2)GUI開發可選擇Tkinter或PyQt,Tkinter簡單易用,PyQt功能豐富,適合專業開發。
 您可以在2小時內學到多少python?
Apr 09, 2025 pm 04:33 PM
您可以在2小時內學到多少python?
Apr 09, 2025 pm 04:33 PM
兩小時內可以學到Python的基礎知識。 1.學習變量和數據類型,2.掌握控制結構如if語句和循環,3.了解函數的定義和使用。這些將幫助你開始編寫簡單的Python程序。
 2小時的Python計劃:一種現實的方法
Apr 11, 2025 am 12:04 AM
2小時的Python計劃:一種現實的方法
Apr 11, 2025 am 12:04 AM
2小時內可以學會Python的基本編程概念和技能。 1.學習變量和數據類型,2.掌握控制流(條件語句和循環),3.理解函數的定義和使用,4.通過簡單示例和代碼片段快速上手Python編程。
 Python與C:學習曲線和易用性
Apr 19, 2025 am 12:20 AM
Python與C:學習曲線和易用性
Apr 19, 2025 am 12:20 AM
Python更易學且易用,C 則更強大但複雜。 1.Python語法簡潔,適合初學者,動態類型和自動內存管理使其易用,但可能導致運行時錯誤。 2.C 提供低級控制和高級特性,適合高性能應用,但學習門檻高,需手動管理內存和類型安全。
 Python:探索其主要應用程序
Apr 10, 2025 am 09:41 AM
Python:探索其主要應用程序
Apr 10, 2025 am 09:41 AM
Python在web開發、數據科學、機器學習、自動化和腳本編寫等領域有廣泛應用。 1)在web開發中,Django和Flask框架簡化了開發過程。 2)數據科學和機器學習領域,NumPy、Pandas、Scikit-learn和TensorFlow庫提供了強大支持。 3)自動化和腳本編寫方面,Python適用於自動化測試和系統管理等任務。
 Python和時間:充分利用您的學習時間
Apr 14, 2025 am 12:02 AM
Python和時間:充分利用您的學習時間
Apr 14, 2025 am 12:02 AM
要在有限的時間內最大化學習Python的效率,可以使用Python的datetime、time和schedule模塊。 1.datetime模塊用於記錄和規劃學習時間。 2.time模塊幫助設置學習和休息時間。 3.schedule模塊自動化安排每週學習任務。
 Python:自動化,腳本和任務管理
Apr 16, 2025 am 12:14 AM
Python:自動化,腳本和任務管理
Apr 16, 2025 am 12:14 AM
Python在自動化、腳本編寫和任務管理中表現出色。 1)自動化:通過標準庫如os、shutil實現文件備份。 2)腳本編寫:使用psutil庫監控系統資源。 3)任務管理:利用schedule庫調度任務。 Python的易用性和豐富庫支持使其在這些領域中成為首選工具。
