

使用 Python 進行綜合天氣資料分析:溫度、降雨趨勢和視覺化

-
ケニアのさまざまな都市の気象データの分析と予測
- はじめに
- データセットの概要
- 探索的データ分析
- 主要な気象特徴の視覚化
- 気象状況分析
- 都市別降雨量
- 月平均気温
- 月間平均降水量
- 気象変数間の相関関係
- ケーススタディ: 都市特有の傾向
- 結論
ケニアのさまざまな都市の気象データの分析と予測
導入
この記事では、Python を使用して天気パターンを分析する方法を説明します。気温傾向の特定から降水量の視覚化まで、このステップバイステップのガイドは、気象分析にデータ サイエンス技術を使用することに興味がある人に最適です。実用的な洞察を得るために、コード、データ操作、視覚化について調査します。
ケニアでは、天気は多くの分野、特に農業、観光、野外活動において重要な役割を果たしています。農家、企業、イベント プランナーは、意思決定を行うために正確な気象情報を必要としています。ただし、気象パターンは地域ごとに大きく異なる可能性があり、現在の予測システムでは常に局所的な洞察が得られるとは限りません。
このプロジェクトの目的は、ケニア全土のさまざまな地域の OpenWeatherMap API と Weather API からリアルタイムの気象データを収集することです。このデータはデータベースに保存され、Python を使用して分析され、次のような洞察が明らかになります。-
- 気温の傾向
- 降雨パターン - 湿度と風の状態
このプロジェクトでは、ケニアのさまざまな都市の気象情報を含むデータセットを分析します。データセットには、温度、湿度、気圧、風速、視程、降雨量などの要素を含む 3,000 行を超える気象観測結果が含まれています。これらの洞察を使用して、農業、観光、さらには管理などの天候に敏感なセクターにおける意思決定を支援できる、正確な地域固有の天気予報を提供することを目指しています。
データセットの概要
データセットはいくつかの列を使用して構造化されました:
- Datetime - 天気がいつ記録されたかを示すタイムスタンプ。
- 都市と国 - 気象観測の場所。
- 緯度と経度 - 場所の地理座標。
- 温度 (摂氏) - 記録された温度。
- 湿度 (%) - 空気中の湿度の割合。
- 圧力 (hPa) - ヘクトパスカル単位の大気圧。
- 風速 (m/s) - その時の風速。
- 雨 (mm) - ミリメートル単位で測定された降雨量。
- 雲 (%) - 雲の範囲の割合。
- 気象条件と天気の説明 - 天気の一般的および詳細な説明 (例: 「雲」、「散在雲」)。
これは、データベース内でデータがどのように構造化されているかです。

探索的データ分析
分析の最初のステップには、データの基本的な調査が含まれていました。
_ データ ディメンション - データセットには 3,000 行と 14 列が含まれています。
_ Null 値 - データの欠落が最小限に抑えられ、さらなる分析に対してデータセットの信頼性が保証されます。
print(df1[['temperature_celsius', 'humidity_pct', 'pressure_hpa', 'wind_speed_ms', 'rain', 'clouds']].describe())
上記のコードを使用して、温度、湿度、圧力、降雨量、雲の範囲、平均、広がりについての洞察を提供する数値列の要約統計量を計算しました。
主要な気象特徴の視覚化
気象の特徴をより明確に理解するために、さまざまな分布をプロットしました。
温度分布
sns.displot(df1['temperature_celsius'], bins=50, kde=True)
plt.title('Temperature Distribution')
plt.xlabel('Temperature (Celsius)')
この分布は、都市全体の気温の一般的な広がりを明らかにします。 KDE ライン プロットは、温度の確率分布を滑らかに推定します。
降水量分布
sns.displot(df1['rain'], bins=50, kde=True)
plt.title('Rainfall Distribution')
plt.xlabel('Rainfall (mm/h)')
このコードは、ケニアの都市全体の降雨分布を分析します。
湿度、気圧、風速
湿度 (%)、気圧 (hPa)、および 風速 (m/s) の同様の分布プロットは、それぞれについて有益な洞察を提供します。データセット全体にわたるこれらのパラメーターのバリエーション
気象状況の分析
気象条件 (「雲」、「雨」など) がカウントされ、円グラフを使用して視覚化され、その比例分布が示されました。
condition_counts = df1['weather_condition'].value_counts()

plt.figure(figsize=(8,8))
plt.pie(condition_counts, labels=condition_counts.index, autopct='%1.1f%%', pctdistance=1.1, labeldistance=0.6, startangle=140)
plt.title('Distribution of Weather Conditions')
plt.axis('equal')
plt.show()

City-wise Rainfall
One of the key analysis was the total rainfall by city:
rainfall_by_city = df1.groupby('city')['rain'].sum().sort_values()

plt.figure(figsize=(12,12))
rainfall_by_city.plot(kind='barh', color='skyblue')
plt.title('Total Rainfall by City')
plt.xlabel('Total Rainfall (mm)')
plt.ylabel('City')
plt.tight_layout()
plt.show()
This bar plot highlighted which cities received the most rain over the observed period, with a few outliers showing significant rainfall compared to others.

Average Monthly Temperature
avg_temp_by_month.plot(kind='line')
plt.title('Average Monthly Temperature')
The line chart revealed temperature fluctuations across different months, showing seasonal changes.

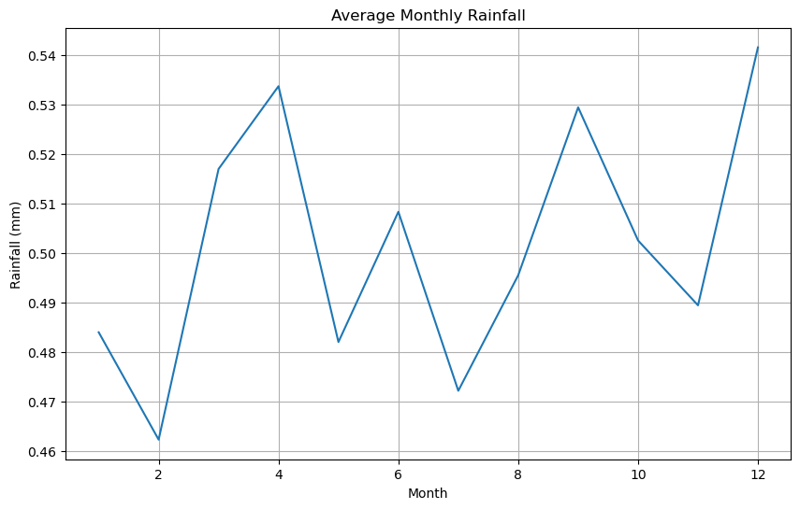
Average Monthly Rainfall
monthly_rain.plot(kind='line')
plt.title('Average Monthly Rainfall')
Similarly, rainfall was analyzed to observe how it varied month-to-month.
We also visualized the data using heatmaps for a more intuitive understanding of monthly temperature and rainfall.
Here are the heatmaps for the average monthly temperature and rainfall


Correlation Between Weather Variables
Next, I calculated the correlation matrix between key weather variables:
correlation_matrix = df1[['temperature_celsius', 'humidity_pct', 'pressure_hpa', 'wind_speed_ms', 'rain', 'clouds']].corr()
correlation_matrix
sns.heatmap(correlation_matrix, annot=True, cmap='coolwarm')
plt.title('Correlation Between Weather Variables')
This heatmap allowed us to identify relationships between variables. For example, we observed a negative correlation between temperature and humidity, as expected.
Case Study: City Specific Trends
I have focused on individual cities such as Mombasa and Nyeri, to explore their unique weather patterns:
Mombasa Temperature Trends
plt.plot(monthly_avg_temp_msa)
plt.title('Temperature Trends in Mombasa Over Time')
This city showed significant variation in temperature across the year.
Nyeri Rainfall Trends
plt.plot(monthly_avg_rain_nyr)
plt.title('Rainfall Trends in Nyeri Over Time')
The rainfall data for Nyeri displayed a clear seasonal pattern, with rainfall peaking during certain months.
Conclusion
This analysis provides a comprehensive overview of the weather conditions in major cities, highlighting the temperature, rainfall, and other key weather variables. By using visualizations like histograms, line charts, pie charts, and heatmaps, we were able to extract meaningful insights into the data. Further analysis could involve comparing these trends with historical weather patterns or exploring predictive modeling to forecast future weather trends.
You can find the Jupyter Notebook with the full code for this analysis in my GitHub repository).
以上是使用 Python 進行綜合天氣資料分析:溫度、降雨趨勢和視覺化的詳細內容。更多資訊請關注PHP中文網其他相關文章!

熱AI工具

Undresser.AI Undress
人工智慧驅動的應用程序,用於創建逼真的裸體照片

AI Clothes Remover
用於從照片中去除衣服的線上人工智慧工具。

Undress AI Tool
免費脫衣圖片

Clothoff.io
AI脫衣器

Video Face Swap
使用我們完全免費的人工智慧換臉工具,輕鬆在任何影片中換臉!

熱門文章
熱工具

記事本++7.3.1
好用且免費的程式碼編輯器

SublimeText3漢化版
中文版,非常好用

禪工作室 13.0.1
強大的PHP整合開發環境

Dreamweaver CS6
視覺化網頁開發工具

SublimeText3 Mac版
神級程式碼編輯軟體(SublimeText3)


 Python vs.C:申請和用例
Apr 12, 2025 am 12:01 AM
Python vs.C:申請和用例
Apr 12, 2025 am 12:01 AM
Python适合数据科学、Web开发和自动化任务,而C 适用于系统编程、游戏开发和嵌入式系统。Python以简洁和强大的生态系统著称,C 则以高性能和底层控制能力闻名。
 您可以在2小時內學到多少python?
Apr 09, 2025 pm 04:33 PM
您可以在2小時內學到多少python?
Apr 09, 2025 pm 04:33 PM
兩小時內可以學到Python的基礎知識。 1.學習變量和數據類型,2.掌握控制結構如if語句和循環,3.了解函數的定義和使用。這些將幫助你開始編寫簡單的Python程序。
 2小時的Python計劃:一種現實的方法
Apr 11, 2025 am 12:04 AM
2小時的Python計劃:一種現實的方法
Apr 11, 2025 am 12:04 AM
2小時內可以學會Python的基本編程概念和技能。 1.學習變量和數據類型,2.掌握控制流(條件語句和循環),3.理解函數的定義和使用,4.通過簡單示例和代碼片段快速上手Python編程。
 Python:遊戲,Guis等
Apr 13, 2025 am 12:14 AM
Python:遊戲,Guis等
Apr 13, 2025 am 12:14 AM
Python在遊戲和GUI開發中表現出色。 1)遊戲開發使用Pygame,提供繪圖、音頻等功能,適合創建2D遊戲。 2)GUI開發可選擇Tkinter或PyQt,Tkinter簡單易用,PyQt功能豐富,適合專業開發。
 Python與C:學習曲線和易用性
Apr 19, 2025 am 12:20 AM
Python與C:學習曲線和易用性
Apr 19, 2025 am 12:20 AM
Python更易學且易用,C 則更強大但複雜。 1.Python語法簡潔,適合初學者,動態類型和自動內存管理使其易用,但可能導致運行時錯誤。 2.C 提供低級控制和高級特性,適合高性能應用,但學習門檻高,需手動管理內存和類型安全。
 Python和時間:充分利用您的學習時間
Apr 14, 2025 am 12:02 AM
Python和時間:充分利用您的學習時間
Apr 14, 2025 am 12:02 AM
要在有限的時間內最大化學習Python的效率,可以使用Python的datetime、time和schedule模塊。 1.datetime模塊用於記錄和規劃學習時間。 2.time模塊幫助設置學習和休息時間。 3.schedule模塊自動化安排每週學習任務。
 Python:探索其主要應用程序
Apr 10, 2025 am 09:41 AM
Python:探索其主要應用程序
Apr 10, 2025 am 09:41 AM
Python在web開發、數據科學、機器學習、自動化和腳本編寫等領域有廣泛應用。 1)在web開發中,Django和Flask框架簡化了開發過程。 2)數據科學和機器學習領域,NumPy、Pandas、Scikit-learn和TensorFlow庫提供了強大支持。 3)自動化和腳本編寫方面,Python適用於自動化測試和系統管理等任務。
 Python:自動化,腳本和任務管理
Apr 16, 2025 am 12:14 AM
Python:自動化,腳本和任務管理
Apr 16, 2025 am 12:14 AM
Python在自動化、腳本編寫和任務管理中表現出色。 1)自動化:通過標準庫如os、shutil實現文件備份。 2)腳本編寫:使用psutil庫監控系統資源。 3)任務管理:利用schedule庫調度任務。 Python的易用性和豐富庫支持使其在這些領域中成為首選工具。
