以下是程式碼各部分功能的詳細說明:
matplotlib.pyplot 用於建立繪圖。
yahooquery.Ticker 用於從雅虎財經取得歷史股票資料。
datetime 和 timedelta 用於日期操作。
pandas 用於資料處理。
pytz 用於處理時區。
os 用於檔案系統操作。
函數參數:
符號:股票代碼(例如“NVDA”)。
n_days:顯示歷史資料的天數。
filename:儲存繪圖的檔案名稱。
timezone:顯示資料的時區。
當前日期和周期開始日期是根據n_days計算的。
yahooquery 用於檢索指定時間內的歷史股票資料。
如果沒有可用數據,則會列印一則訊息,然後函數退出。
資料的索引轉換為日期時間格式並設定時區。
週末(週六和週日)被過濾掉。
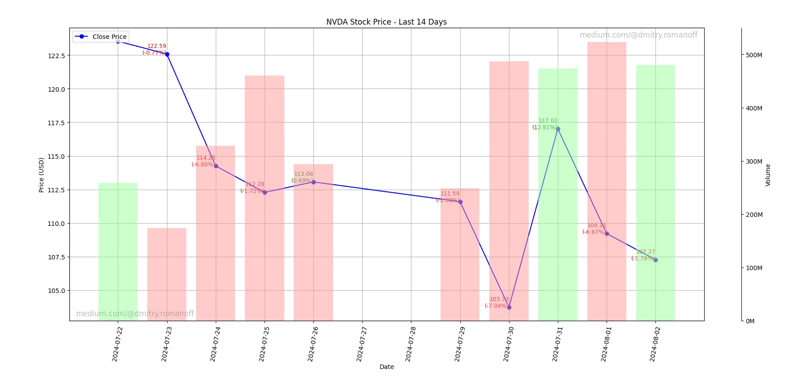
計算收盤價的百分比變化。
主要情節是根據收盤價創建的。
繪圖中新增了註釋,顯示收盤價和百分比變化。
配置 X 和 Y 軸、設定日期格式並新增網格線。
增加了額外的交易量圖,以不同的顏色表示收盤價的正向和負向變化。
浮水印加到圖的左下角和右上角。
繪圖將儲存為具有指定檔案名稱的影像檔案並顯示。
使用程式碼“NVDA”(NVIDIA) 呼叫該函數,顯示過去 14 天的數據,將繪圖儲存為“output.png”,並使用 GMT 時區。
總之,代碼產生歷史股票數據的可視化表示,包括收盤價和交易量,以及百分比變化和時區注意事項的註釋。
import matplotlib.pyplot as plt
from yahooquery import Ticker
from datetime import datetime, timedelta
import matplotlib.dates as mdates
import os
import pandas as pd
import pytz

def plot_stock_last_n_days(symbol, n_days=30, filename='stock_plot.png', timezone='UTC'):
    # Define the date range
    end_date = datetime.now(pytz.timezone(timezone))
    start_date = end_date - timedelta(days=n_days)

    # Convert dates to the format expected by Yahoo Finance
    start_date_str = start_date.strftime('%Y-%m-%d')
    end_date_str = end_date.strftime('%Y-%m-%d')

    # Fetch historical data for the last n days
    ticker = Ticker(symbol)
    historical_data = ticker.history(start=start_date_str, end=end_date_str, interval='1d')

    # Check if the data is available
    if historical_data.empty:
        print("No data available.")
        return

    # Ensure the index is datetime for proper plotting and localize to the specified timezone
    historical_data.index = pd.to_datetime(historical_data.index.get_level_values('date')).tz_localize('UTC').tz_convert(timezone)

    # Filter out weekends
    historical_data = historical_data[historical_data.index.weekday < 5]

    # Calculate percentage changes
    historical_data['pct_change'] = historical_data['close'].pct_change() * 100

    # Ensure the output directory exists
    output_dir = 'output'
    if not os.path.exists(output_dir):
        os.makedirs(output_dir)

    # Adjust the filename to include the output directory
    filename = os.path.join(output_dir, filename)

    # Plotting the closing price
    fig, ax1 = plt.subplots(figsize=(10, 5))
    ax1.plot(historical_data.index, historical_data['close'], label='Close Price', color='blue', marker='o')

    # Annotate each point with its value and percentage change
    for i in range(1, len(historical_data)):
        date = historical_data.index[i]
        close = historical_data['close'].iloc[i]
        pct_change = historical_data['pct_change'].iloc[i]
        color = 'green' if pct_change > 0 else 'red'
        ax1.text(date, close, f'{close:.2f}\n({pct_change:.2f}%)', fontsize=9, ha='right', color=color)

    # Set up daily gridlines and print date for every day
    ax1.xaxis.set_major_locator(mdates.DayLocator(interval=1))
    ax1.xaxis.set_major_formatter(mdates.DateFormatter('%Y-%m-%d'))

    ax1.set_xlabel('Date')
    ax1.set_ylabel('Price (USD)')
    ax1.set_title(f'{symbol} Stock Price - Last {n_days} Days')
    ax1.legend(loc='upper left')
    ax1.grid(True)
    ax1.tick_params(axis='x', rotation=80)
    fig.tight_layout()

    # Adding the trading volume plot
    ax2 = ax1.twinx()
    calm_green = (0.6, 1, 0.6)  # Calm green color
    calm_red = (1, 0.6, 0.6)    # Calm red color
    colors = [calm_green if historical_data['close'].iloc[i] > historical_data['open'].iloc[i] else calm_red for i in range(len(historical_data))]
    ax2.bar(historical_data.index, historical_data['volume'], color=colors, alpha=0.5, width=0.8)
    ax2.set_ylabel('Volume')
    ax2.tick_params(axis='y')

    # Format y-axis for volume in millions
    def millions(x, pos):
        'The two args are the value and tick position'
        return '%1.0fM' % (x * 1e-6)

    ax2.yaxis.set_major_formatter(plt.FuncFormatter(millions))

    # Adjust the visibility and spacing of the volume axis
    fig.subplots_adjust(right=0.85)
    ax2.spines['right'].set_position(('outward', 60))
    ax2.yaxis.set_label_position('right')
    ax2.yaxis.set_ticks_position('right')

    # Add watermarks
    plt.text(0.01, 0.01, 'medium.com/@dmitry.romanoff', fontsize=12, color='grey', ha='left', va='bottom', alpha=0.5, transform=plt.gca().transAxes)
    plt.text(0.99, 0.99, 'medium.com/@dmitry.romanoff', fontsize=12, color='grey', ha='right', va='top', alpha=0.5, transform=plt.gca().transAxes)

    # Save the plot as an image file
    plt.savefig(filename)
    plt.show()

# Example usage
plot_stock_last_n_days('NVDA', n_days=14, filename='output.png', timezone='GMT')
以上是產生最近 n 天的股票價格圖表的 Python 程式碼。的詳細內容。更多資訊請關注PHP中文網其他相關文章!


