分割是影像分析中的基本技術,它允許我們根據物件、形狀或顏色將影像劃分為有意義的部分。它在物體檢測、電腦視覺甚至藝術圖像處理等應用中發揮關鍵作用。但如何才能有效實現細分呢?幸運的是,OpenCV (cv2) 提供了幾種用戶友好且強大的分割方法。
在本教學中,我們將探討三種流行的分割技術:
為了使本教程引人入勝且實用,我們將使用來自日本大阪的衛星和航空圖像,重點關注古代古墳。您可以從教學的 GitHub 頁面下載這些圖像和相應的範例筆記本。
Canny 邊緣偵測是一種簡單且強大的方法來辨識影像中的邊緣。它的工作原理是檢測強度快速變化的區域,這些區域通常是物體的邊界。該技術透過應用強度閾值來產生“薄邊緣”輪廓。讓我們深入了解它使用 OpenCV 的實作。
範例:偵測衛星影像中的邊緣
在這裡,我們使用大阪的衛星圖像,特別是古墳,作為測試案例。
import cv2
import numpy as np
import matplotlib.pyplot as plt
files = sorted(glob("SAT*.png")) #Get png files
print(len(files))
img=cv2.imread(files[0])
use_image= img[0:600,700:1300]
gray = cv2.cvtColor(use_image, cv2.COLOR_BGR2GRAY)

#Stadard values
min_val = 100
max_val = 200
# Apply Canny Edge Detection
edges = cv2.Canny(gray, min_val, max_val)
#edges = cv2.Canny(gray, min_val, max_val,apertureSize=5,L2gradient = True )
False
# Show the result
plt.figure(figsize=(15, 5))
plt.subplot(131), plt.imshow(cv2.cvtColor(use_image, cv2.COLOR_BGR2RGB))
plt.title('Original Image'), plt.axis('off')
plt.subplot(132), plt.imshow(gray, cmap='gray')
plt.title('Grayscale Image'), plt.axis('off')
plt.subplot(133), plt.imshow(edges, cmap='gray')
plt.title('Canny Edges'), plt.axis('off')
plt.show()

輸出邊緣清晰地勾勒出古墳和其他感興趣區域的部分輪廓。然而,由於閾值過大,一些區域被遺漏了。結果在很大程度上取決於 min_val 和 max_val 的選擇以及影像品質。
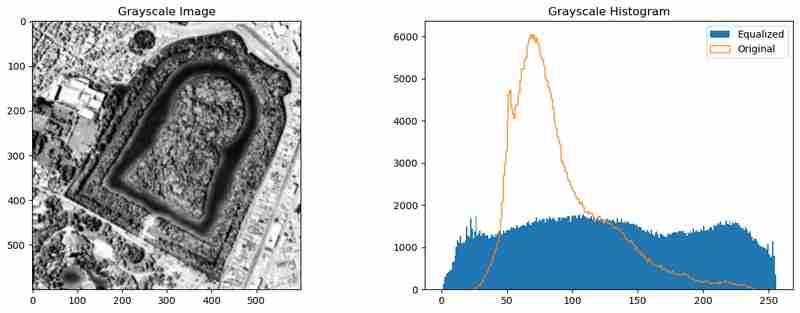
為了增強邊緣偵測,我們可以對影像進行預處理以分散像素強度並減少雜訊。這可以使用直方圖均衡 (cv2.equalizeHist()) 和高斯模糊 (cv2.GaussianBlur()) 來實現。
use_image= img[0:600,700:1300]
gray = cv2.cvtColor(use_image, cv2.COLOR_BGR2GRAY)
gray_og = gray.copy()
gray = cv2.equalizeHist(gray)
gray = cv2.GaussianBlur(gray, (9, 9),1)

plt.figure(figsize=(15, 5))
plt.subplot(121), plt.imshow(gray, cmap='gray')
plt.title('Grayscale Image')
plt.subplot(122)
_= plt.hist(gray.ravel(), 256, [0,256],label="Equalized")
_ = plt.hist(gray_og.ravel(), 256, [0,256],label="Original",histtype='step')
plt.legend()
plt.title('Grayscale Histogram')

這種預處理可以均勻強度分佈並平滑影像,這有助於 Canny 邊緣偵測演算法捕捉更有意義的邊緣。
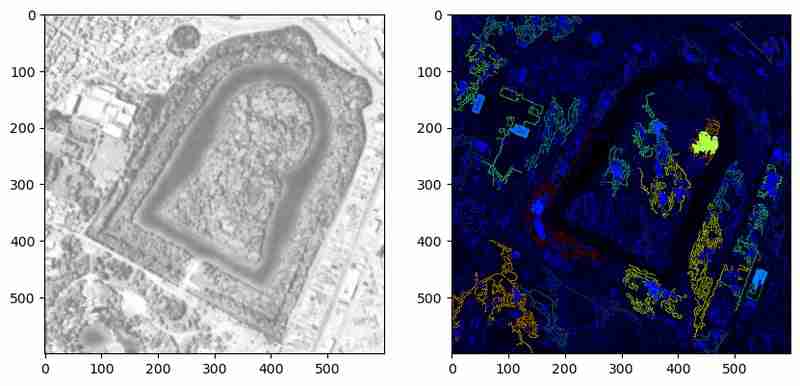
邊緣很有用,但它們僅表示邊界。為了分割封閉區域,我們將邊緣轉換為輪廓並視覺化它們。
# Edges to contours
contours, hierarchy = cv2.findContours(edges, cv2.RETR_TREE, cv2.CHAIN_APPROX_SIMPLE)
# Calculate contour areas
areas = [cv2.contourArea(contour) for contour in contours]

# Normalize areas for the colormap
normalized_areas = np.array(areas)
if normalized_areas.max() > 0:
    normalized_areas = normalized_areas / normalized_areas.max()

# Create a colormap
cmap = plt.cm.jet

# Plot the contours with the color map
plt.figure(figsize=(10, 10))
plt.subplot(1,2,1)
plt.imshow(gray, cmap='gray', alpha=0.5)  # Display the grayscale image in the background
mask = np.zeros_like(use_image)
for contour, norm_area in zip(contours, normalized_areas):
    color = cmap(norm_area)  # Map the normalized area to a color
    color = [int(c*255) for c in color[:3]]
    cv2.drawContours(mask, [contour], -1, color,-1 )  # Draw contours on the image

plt.subplot(1,2,2)

上述方法以代表其相對區域的顏色突出顯示檢測到的輪廓。這種視覺化有助於驗證輪廓是否形成封閉體或僅形成線條。然而,在此範例中,許多輪廓仍然是未閉合的多邊形。進一步的預處理或參數調整可以解決這些限制。
透過結合預處理和輪廓分析,Canny 邊緣偵測成為辨識影像中物件邊界的強大工具。然而,當物件定義明確且噪音最小時,它的效果最佳。接下來,我們將探索 K 均值聚類以按顏色分割影像,從而為相同資料提供不同的視角。
K-Means 聚類是資料科學中一種流行的方法,用於將相似的項目分組為聚類,並且它對於基於顏色相似性的圖像分割特別有效。 OpenCV 的 cv2.kmeans 函數簡化了此過程,使其可以執行物件分割、背景移除或視覺分析等任務。
在本節中,我們將使用 K 均值聚類將古墳墓影像分割為相似顏色的區域。
首先,我們對影像的 RGB 值套用 K 均值聚類,將每個像素視為一個資料點。
import cv2
import numpy as np
import matplotlib.pyplot as plt
files = sorted(glob("SAT*.png")) #Get png files
print(len(files))
img=cv2.imread(files[0])
use_image= img[0:600,700:1300]
gray = cv2.cvtColor(use_image, cv2.COLOR_BGR2GRAY)

#Stadard values
min_val = 100
max_val = 200
# Apply Canny Edge Detection
edges = cv2.Canny(gray, min_val, max_val)
#edges = cv2.Canny(gray, min_val, max_val,apertureSize=5,L2gradient = True )
False
# Show the result
plt.figure(figsize=(15, 5))
plt.subplot(131), plt.imshow(cv2.cvtColor(use_image, cv2.COLOR_BGR2RGB))
plt.title('Original Image'), plt.axis('off')
plt.subplot(132), plt.imshow(gray, cmap='gray')
plt.title('Grayscale Image'), plt.axis('off')
plt.subplot(133), plt.imshow(edges, cmap='gray')
plt.title('Canny Edges'), plt.axis('off')
plt.show()

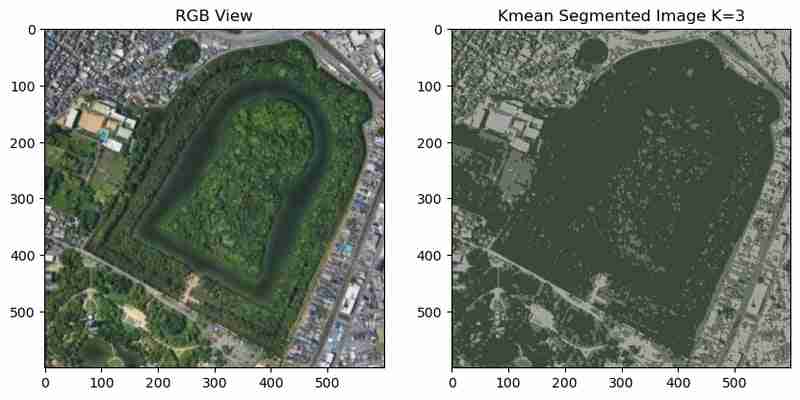
在分割影像中,古墳和周圍區域聚集成不同的顏色。然而,噪音和顏色的微小變化會導致簇分散,這會為解釋帶來挑戰。
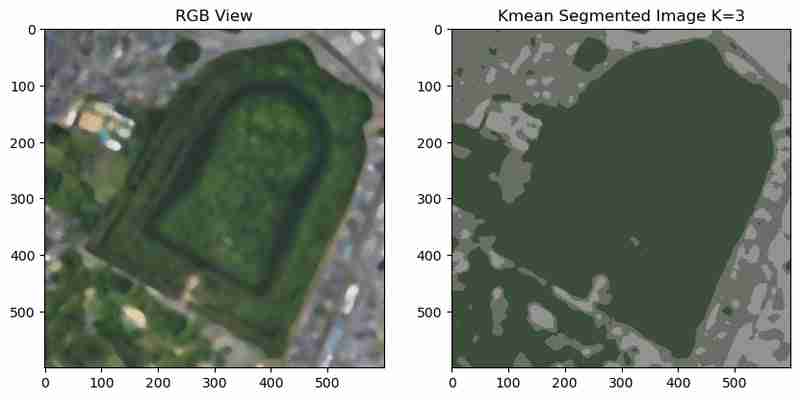
為了減少噪音並創建更平滑的聚類,我們可以在運行 K-Means 之前應用中位數模糊。
use_image= img[0:600,700:1300]
gray = cv2.cvtColor(use_image, cv2.COLOR_BGR2GRAY)
gray_og = gray.copy()
gray = cv2.equalizeHist(gray)
gray = cv2.GaussianBlur(gray, (9, 9),1)

plt.figure(figsize=(15, 5))
plt.subplot(121), plt.imshow(gray, cmap='gray')
plt.title('Grayscale Image')
plt.subplot(122)
_= plt.hist(gray.ravel(), 256, [0,256],label="Equalized")
_ = plt.hist(gray_og.ravel(), 256, [0,256],label="Original",histtype='step')
plt.legend()
plt.title('Grayscale Histogram')

模糊的影像會產生更平滑的簇,減少噪音並使分割區域在視覺上更具凝聚力。
為了更好地理解分割結果,我們可以使用 matplotlib plt.fill_ Between;
建立獨特簇顏色的顏色圖
# Edges to contours
contours, hierarchy = cv2.findContours(edges, cv2.RETR_TREE, cv2.CHAIN_APPROX_SIMPLE)
# Calculate contour areas
areas = [cv2.contourArea(contour) for contour in contours]

# Normalize areas for the colormap
normalized_areas = np.array(areas)
if normalized_areas.max() > 0:
    normalized_areas = normalized_areas / normalized_areas.max()

# Create a colormap
cmap = plt.cm.jet

# Plot the contours with the color map
plt.figure(figsize=(10, 10))
plt.subplot(1,2,1)
plt.imshow(gray, cmap='gray', alpha=0.5)  # Display the grayscale image in the background
mask = np.zeros_like(use_image)
for contour, norm_area in zip(contours, normalized_areas):
    color = cmap(norm_area)  # Map the normalized area to a color
    color = [int(c*255) for c in color[:3]]
    cv2.drawContours(mask, [contour], -1, color,-1 )  # Draw contours on the image

plt.subplot(1,2,2)

這種視覺化可以深入了解影像中的主色及其對應的 RGB 值,這對於進一步分析非常有用。因為我們現在可以屏蔽並選擇我的顏色代碼區域。
簇的數量 (K) 顯著影響結果。增加 K 會創建更詳細的細分,而較低的值會產生更廣泛的分組。為了進行實驗,我們可以迭代多個 K 值。
import cv2
import numpy as np
import matplotlib.pyplot as plt
files = sorted(glob("SAT*.png")) #Get png files
print(len(files))
img=cv2.imread(files[0])
use_image= img[0:600,700:1300]
gray = cv2.cvtColor(use_image, cv2.COLOR_BGR2GRAY)

#Stadard values
min_val = 100
max_val = 200
# Apply Canny Edge Detection
edges = cv2.Canny(gray, min_val, max_val)
#edges = cv2.Canny(gray, min_val, max_val,apertureSize=5,L2gradient = True )
False
# Show the result
plt.figure(figsize=(15, 5))
plt.subplot(131), plt.imshow(cv2.cvtColor(use_image, cv2.COLOR_BGR2RGB))
plt.title('Original Image'), plt.axis('off')
plt.subplot(132), plt.imshow(gray, cmap='gray')
plt.title('Grayscale Image'), plt.axis('off')
plt.subplot(133), plt.imshow(edges, cmap='gray')
plt.title('Canny Edges'), plt.axis('off')
plt.show()

不同 K 值的聚類結果揭示了細節和簡單性之間的權衡:
・較低的 K 值(例如 2-3):聚類範圍廣泛,區分清晰,適合高階分割。
・較高的 K 值(例如 12-15):更詳細的分割,但代價是增加複雜性和潛在的過度分割。
K-Means 聚類是一種基於色彩相似性分割影像的強大技術。透過正確的預處理步驟,它可以產生清晰且有意義的區域。然而,其性能取決於 K 的選擇、輸入影像的品質以及所應用的預處理。接下來,我們將探索分水嶺演算法,該演算法利用地形特徵來實現物件和區域的精確分割。
分水嶺演算法的靈感來自地形圖,其中分水嶺劃分流域。此方法將灰階強度值視為高程,有效地創建“峰”和“谷”。透過識別感興趣區域,該演算法可以分割具有精確邊界的物件。它對於分離重疊物件特別有用,使其成為細胞分割、物件偵測和區分密集特徵等複雜場景的絕佳選擇。
第一步是預處理影像以增強特徵,然後應用分水嶺演算法。
use_image= img[0:600,700:1300]
gray = cv2.cvtColor(use_image, cv2.COLOR_BGR2GRAY)
gray_og = gray.copy()
gray = cv2.equalizeHist(gray)
gray = cv2.GaussianBlur(gray, (9, 9),1)

plt.figure(figsize=(15, 5))
plt.subplot(121), plt.imshow(gray, cmap='gray')
plt.title('Grayscale Image')
plt.subplot(122)
_= plt.hist(gray.ravel(), 256, [0,256],label="Equalized")
_ = plt.hist(gray_og.ravel(), 256, [0,256],label="Original",histtype='step')
plt.legend()
plt.title('Grayscale Histogram')
分段區域和邊界可以與中間處理步驟一起視覺化。

# Edges to contours
contours, hierarchy = cv2.findContours(edges, cv2.RETR_TREE, cv2.CHAIN_APPROX_SIMPLE)
# Calculate contour areas
areas = [cv2.contourArea(contour) for contour in contours]

# Normalize areas for the colormap
normalized_areas = np.array(areas)
if normalized_areas.max() > 0:
    normalized_areas = normalized_areas / normalized_areas.max()

# Create a colormap
cmap = plt.cm.jet

# Plot the contours with the color map
plt.figure(figsize=(10, 10))
plt.subplot(1,2,1)
plt.imshow(gray, cmap='gray', alpha=0.5)  # Display the grayscale image in the background
mask = np.zeros_like(use_image)
for contour, norm_area in zip(contours, normalized_areas):
    color = cmap(norm_area)  # Map the normalized area to a color
    color = [int(c*255) for c in color[:3]]
    cv2.drawContours(mask, [contour], -1, color,-1 )  # Draw contours on the image

plt.subplot(1,2,2)
演算法成功辨識不同的區域並在物件周圍繪製清晰的邊界。在本例中,古墳被精確分割。然而,此演算法的性能在很大程度上取決於閾值處理、噪音去除和形態學操作等預處理步驟。
加入進階預處理,例如直方圖均衡或自適應模糊,可以進一步增強結果。例如:
# Kmean color segmentation
use_image= img[0:600,700:1300]
#use_image = cv2.medianBlur(use_image, 15)


 # Reshape image for k-means
pixel_values = use_image.reshape((-1, 3)) if len(use_image.shape) == 3 else use_image.reshape((-1, 1))
pixel_values = np.float32(pixel_values)

criteria = (cv2.TERM_CRITERIA_EPS + cv2.TERM_CRITERIA_MAX_ITER, 10, 1.0)
K = 3
attempts=10
ret,label,center=cv2.kmeans(pixel_values,K,None,criteria,attempts,cv2.KMEANS_PP_CENTERS)

centers = np.uint8(center)
segmented_data = centers[label.flatten()]
segmented_image = segmented_data.reshape(use_image.shape)

plt.figure(figsize=(10, 6))
plt.subplot(1,2,1),plt.imshow(use_image[:,:,::-1])
plt.title("RGB View")
plt.subplot(1,2,2),plt.imshow(segmented_image[:,:,[2,1,0]])
plt.title(f"Kmean Segmented Image K={K}")

透過這些調整,可以準確分割更多區域,並最大限度地減少雜訊偽影。
分水嶺演算法在需要精確邊界劃分和重疊物件分離的場景中表現出色。透過利用預處理技術,它甚至可以有效地處理像古墳古墳區域這樣的複雜圖像。然而,它的成功取決於仔細的參數調整和預處理。
分割是影像分析中的重要工具,提供了隔離和理解影像中不同元素的途徑。本教學展示了三種強大的分割技術:Canny 邊緣偵測、K 均值聚類和分水嶺演算法,每種技術都是針對特定應用程式量身定制的。從勾勒出大阪古古墳的輪廓,到聚類城市景觀和劃分不同區域,這些方法凸顯了 OpenCV 在應對現實世界挑戰方面的多功能性。
現在去將其中的一些方法應用到您選擇的應用程式中,並發表評論並分享結果。另外,如果您知道任何其他簡單的分割方法,也請分享
以上是[Python-CV影像分割:Canny邊緣、分水嶺和K-Means方法的詳細內容。更多資訊請關注PHP中文網其他相關文章!


