網路抓取與分析外語數據
最近我決定做一個快速的網頁抓取和資料分析專案。因為我的大腦喜歡想出需要花費大量時間的大想法,所以我決定挑戰自己,想出一些可以在幾個小時內完成的簡單事情。
這是我想到的:
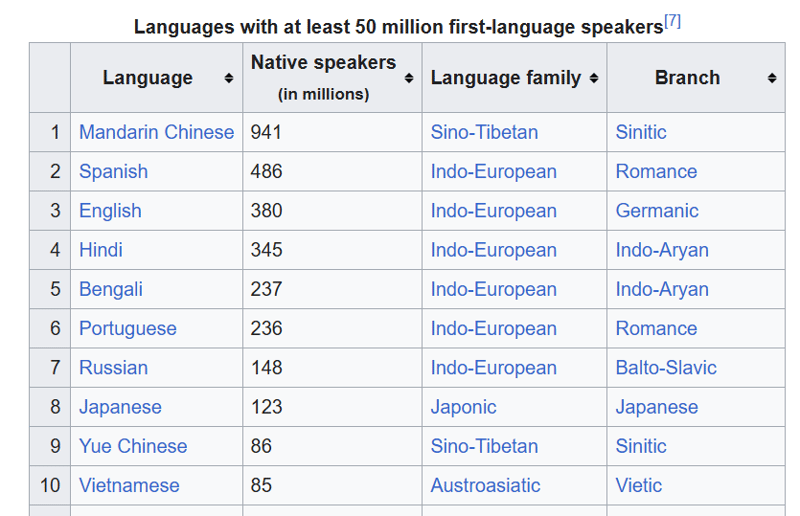
由於我的本科學位最初是外語(法語和西班牙語),我認為網絡抓取一些語言相關數據會很有趣。我想使用 BeautifulSoup 庫,它可以解析靜態 html,但無法處理需要 onclick 事件來顯示整個資料集的動態網頁(即,如果頁面已分頁,則單擊下一頁資料)。
我決定使用最常用語言的維基百科頁面。

我想做以下事情:
- 取得頁面的 html 並輸出到 .txt 檔案
- 使用beautiful soup解析html檔案並擷取表格資料
- 將表格寫入 .csv 檔案
- 使用資料分析提出我想回答此資料集的 10 個問題
- 用 pandas 和 Jupyter Notebook 回答這些問題
我決定將專案分成這些步驟以分離關注點,但我也想避免透過重新運行腳本來發出多個不必要的請求以從維基百科獲取 html。保存 html 文件,然後在單獨的腳本中使用它意味著您不需要不斷重新請求數據,因為您已經擁有了數據。
項目連結
此專案的 github 儲存庫的連結為:https://github.com/gabrielrowan/Foreign-Languages-Analysis
取得html
首先,我檢索並輸出 html。使用 C# 和 C 後,我總是對 Python 程式碼如此簡短和簡潔感到新奇?
url = 'https://en.wikipedia.org/wiki/List_of_languages_by_number_of_native_speakers'

response = requests.get(url)
html = response.text

with open("languages_html.txt", "w", encoding="utf-8") as file:
    file.write(html)
解析 html
為了用 Beautiful soup 解析 html 並選擇我感興趣的表,我做了:
with open("languages_html.txt", "r", encoding="utf-8") as file:
    soup = BeautifulSoup(file, 'html.parser')

# get table
top_languages_table = soup.select_one('.wikitable.sortable.static-row-numbers')
然後,我取得了表格標題文字來取得 pandas 資料框的列名稱:
# get column names
columns = top_languages_table.find_all("th")
column_titles = [column.text.strip() for column in columns]
之後,我建立了資料框,設定列名稱,檢索每個表格行並將每一行寫入資料框:
# get table rows
table_data = top_languages_table.find_all("tr")

# define dataframe
df = pd.DataFrame(columns=column_titles)

# get table data
for row in table_data[1:]:
    row_data = row.find_all('td')
    row_data_txt = [row.text.strip() for row in row_data]
    print(row_data_txt)
    df.loc[len(df)] = row_data_txt
注意 - 不使用 strip() 時,文字中有 n 個不需要的字元。
最後,我將資料幀寫入 .csv。
分析數據
事先,我從數據中提出了我想回答的這些問題:
- 資料集中所有語言的母語總數是多少?
- 有多少種不同類型的語系?
- 每個語系的母語總數是多少?
- 最常用的 3 個語係是什麼?
- 建立一個圓餅圖,顯示最常用的 3 個語系
- 最常見的語系-分支對是什麼?
- 表中哪些語言屬於漢藏語系?
- 顯示所有羅曼語系和日耳曼語系語言的母語人士的長條圖
- 前 5 種語言佔母語使用者總數的百分比是多少?
- 哪個分支的母語使用者最多,哪個分支最少?
結果
雖然我不會透過程式碼來回答所有這些問題,但我會討論涉及圖表的兩個問題。
顯示所有羅曼語和日耳曼語母語的長條圖
首先,我建立了一個資料框,僅包含分支名稱為「Romance」或「Germanic」的行
url = 'https://en.wikipedia.org/wiki/List_of_languages_by_number_of_native_speakers'

response = requests.get(url)
html = response.text

with open("languages_html.txt", "w", encoding="utf-8") as file:
    file.write(html)
然後我指定了圖表的 x 軸、y 軸和條形顏色:
with open("languages_html.txt", "r", encoding="utf-8") as file:
    soup = BeautifulSoup(file, 'html.parser')

# get table
top_languages_table = soup.select_one('.wikitable.sortable.static-row-numbers')
這創建了:

建立一個圓餅圖,顯示 3 個最常用的語系
為了建立圓餅圖,我檢索了最常見的 3 個語系並將它們放入資料框中。
此代碼組取得每個語系的母語人士總數,按降序排序,並提取前 3 個條目。
# get column names
columns = top_languages_table.find_all("th")
column_titles = [column.text.strip() for column in columns]
然後我將資料放入圓餅圖中,指定「母語者」的 y 軸和圖例,這為圖表中顯示的每個語言系列建立顏色編碼標籤。
# get table rows
table_data = top_languages_table.find_all("tr")

# define dataframe
df = pd.DataFrame(columns=column_titles)

# get table data
for row in table_data[1:]:
    row_data = row.find_all('td')
    row_data_txt = [row.text.strip() for row in row_data]
    print(row_data_txt)
    df.loc[len(df)] = row_data_txt

其餘問題的程式碼和答案可以在這裡找到。我在筆記本中使用 Markdown 寫下問題及其答案。
下次:
對於我的網頁抓取和資料分析專案的下一個迭代,我想讓事情變得更複雜:
- 網頁抓取動態頁面,點擊/捲動時會顯示更多資料
- 分析較大的資料集,可能需要在分析之前進行一些資料清理工作

最後的想法
儘管速度很快,但我很喜歡做這個專案。它提醒我,簡短、可管理的專案對於讓練習代表參與其中有多有用?另外,從互聯網提取數據並從中創建圖表,即使數據集很小,也很有趣?
以上是網路抓取與分析外語數據的詳細內容。更多資訊請關注PHP中文網其他相關文章!

熱AI工具

Undresser.AI Undress
人工智慧驅動的應用程序,用於創建逼真的裸體照片

AI Clothes Remover
用於從照片中去除衣服的線上人工智慧工具。

Undress AI Tool
免費脫衣圖片

Clothoff.io
AI脫衣器

Video Face Swap
使用我們完全免費的人工智慧換臉工具,輕鬆在任何影片中換臉!

熱門文章

熱工具

記事本++7.3.1
好用且免費的程式碼編輯器

SublimeText3漢化版
中文版,非常好用

禪工作室 13.0.1
強大的PHP整合開發環境

Dreamweaver CS6
視覺化網頁開發工具

SublimeText3 Mac版
神級程式碼編輯軟體(SublimeText3)
 Python vs.C:申請和用例
Apr 12, 2025 am 12:01 AM
Python适合数据科学、Web开发和自动化任务,而C 适用于系统编程、游戏开发和嵌入式系统。Python以简洁和强大的生态系统著称,C 则以高性能和底层控制能力闻名。
 您可以在2小時內學到多少python?
Apr 09, 2025 pm 04:33 PM
兩小時內可以學到Python的基礎知識。 1.學習變量和數據類型,2.掌握控制結構如if語句和循環,3.了解函數的定義和使用。這些將幫助你開始編寫簡單的Python程序。
 Python:遊戲,Guis等
Apr 13, 2025 am 12:14 AM
Python在遊戲和GUI開發中表現出色。 1)遊戲開發使用Pygame,提供繪圖、音頻等功能,適合創建2D遊戲。 2)GUI開發可選擇Tkinter或PyQt,Tkinter簡單易用,PyQt功能豐富,適合專業開發。
 2小時的Python計劃:一種現實的方法
Apr 11, 2025 am 12:04 AM
2小時內可以學會Python的基本編程概念和技能。 1.學習變量和數據類型,2.掌握控制流(條件語句和循環),3.理解函數的定義和使用,4.通過簡單示例和代碼片段快速上手Python編程。
 Python:探索其主要應用程序
Apr 10, 2025 am 09:41 AM
Python在web開發、數據科學、機器學習、自動化和腳本編寫等領域有廣泛應用。 1)在web開發中,Django和Flask框架簡化了開發過程。 2)數據科學和機器學習領域,NumPy、Pandas、Scikit-learn和TensorFlow庫提供了強大支持。 3)自動化和腳本編寫方面,Python適用於自動化測試和系統管理等任務。
 Python與C:學習曲線和易用性
Apr 19, 2025 am 12:20 AM
Python更易學且易用,C 則更強大但複雜。 1.Python語法簡潔,適合初學者,動態類型和自動內存管理使其易用,但可能導致運行時錯誤。 2.C 提供低級控制和高級特性,適合高性能應用,但學習門檻高,需手動管理內存和類型安全。
 Python和時間:充分利用您的學習時間
Apr 14, 2025 am 12:02 AM
要在有限的時間內最大化學習Python的效率,可以使用Python的datetime、time和schedule模塊。 1.datetime模塊用於記錄和規劃學習時間。 2.time模塊幫助設置學習和休息時間。 3.schedule模塊自動化安排每週學習任務。
 Python:自動化,腳本和任務管理
Apr 16, 2025 am 12:14 AM
Python在自動化、腳本編寫和任務管理中表現出色。 1)自動化:通過標準庫如os、shutil實現文件備份。 2)腳本編寫:使用psutil庫監控系統資源。 3)任務管理:利用schedule庫調度任務。 Python的易用性和豐富庫支持使其在這些領域中成為首選工具。


