

excel groupby函數可分組行和匯總值

Unlock the Power of Excel's GROUPBY Function for Enhanced Data Analysis! This function simplifies data grouping, summarization, sorting, and filtering, all within a single formula. Say goodbye to complex outlines, subtotals, and pivot tables – GROUPBY streamlines your workflow.
Excel's data analysis capabilities just got a significant boost. While features like outlines and pivot tables have long been staples for organizing and interpreting data, the new GROUPBY function offers a more streamlined approach, all within the convenience of your formula bar.
- Understanding the Excel GROUPBY Function: Syntax and Basic Applications
- GROUPBY Function Availability and Compatibility
- Constructing a Basic GROUPBY Formula
- Mastering GROUPBY: Advanced Formula Examples
- Selecting the Right Aggregation Function
- Displaying Headers Effectively
- Grouping Rows Using Multiple Columns
- Grouping with Non-Adjacent Columns
- Controlling the Display of Totals and Subtotals
- Sorting Grouped Data
- Filtering Results
- Aggregating Multiple Columns (Adjacent and Non-Adjacent)
- Multiple Aggregations on a Single Dataset
- Handling Comma-Separated Text Strings
- Auto-Formatting GROUPBY Results with Conditional Formatting
- Troubleshooting GROUPBY Function Issues
The Excel GROUPBY Function
The GROUPBY function efficiently groups and aggregates data rows based on values in one or more columns. It also supports sorting and filtering of grouped data. As a dynamic array function, it returns multiple results, spilling into adjacent cells. The output resembles a pivot table without the formatting; the spill range dynamically recalculates with data changes. This is particularly beneficial for large datasets requiring summarized data through functions like SUM, AVERAGE, or COUNT.

Note: GROUPBY is similar to PIVOTBY, but GROUPBY exclusively groups data in rows.
Function Syntax
GROUPBY(row_fields, values, function, [field_headers], [total_depth], [sort_order], [filter_array])
Seven arguments are available, but only the first three are mandatory:
-
row_fields(required): The range of values to group by. -
values(required): The values to aggregate. -
function(required): The aggregation function (e.g.,SUM,AVERAGE,COUNT,MIN,MAX). -
field_headers(optional): Controls header display (0: No headers, 1: Yes, but don't show, 2: No headers, but generate, 3: Yes, and show). -
total_depth(optional): Controls total/subtotal display (0: No totals, 1: Grand total at bottom, 2: Grand and subtotals at bottom, -1: Grand total at top, -2: Grand and subtotals at top). -
sort_order(optional): Sorts by column index (positive for ascending, negative for descending). Arrays allow multi-column sorting. -
filter_array(optional): Filters rows using a Boolean array.
Usage Tips
- Dynamic Updates: The formula dynamically adjusts to dataset changes within its range. Adding new rows requires including them in the argument ranges or using an Excel table for automatic expansion.
-
Header Detection: If
field_headersis omitted, Excel infers headers based on thevaluesargument (text followed by a number suggests headers). -
Range Consistency:
row_fieldsandvaluesmust have equal lengths to avoid#VALUE!errors. - Conditional Formatting: Enhance readability by using conditional formatting to highlight totals and subtotals.
Note: GROUPBY is under development; thorough testing is recommended.
GROUPBY Function Availability
Currently available in Excel for Microsoft 365 (Insider Beta Channel).
Basic GROUPBY Formula
Let's assume a dataset with project names (Column A), types (Column B), and revenues (Column C). To summarize revenues by project type:
=GROUPBY(B2:B32, C2:C32, SUM)
This yields a list of unique project types with their revenue sums. Defaults are used for optional arguments (no headers, ascending sort, grand total at bottom).

Advanced GROUPBY Formula Examples
This section expands on the basic example, demonstrating the function's versatility.
Choosing the Aggregation Function
GROUPBY supports 16 aggregation functions, including standard functions (SUM, AVERAGE, COUNT, etc.) and specialized ones (PERCENTOF, ARRAYTOTEXT). These are eta-reduced lambdas, simplifying usage. Custom lambda functions are also supported. Multiple aggregations are possible using vectors (vertical for column stacking, horizontal for row stacking).
Displaying Headers
Use the field_headers argument (set to 3) to include headers in the output.
=GROUPBY(B2:B32, C2:C32, SUM, 3)

Grouping by Multiple Columns
Include a multi-column range in row_fields to group by multiple columns. For example, grouping by project type and status:
=GROUPBY(B2:C32, D2:D32, COUNT)

Grouping by Non-Adjacent Columns
Use CHOOSECOLS to select non-adjacent columns for grouping:
=GROUPBY(CHOOSECOLS(A2:D32, 2, 4), C2:C32, COUNT)

Controlling Totals and Subtotals
Use total_depth to control total/subtotal display. Setting it to 2 shows both grand and subtotals.
=GROUPBY(B2:C32, D2:D32, SUM, 3, 2)

Sorting Grouped Rows
Use sort_order for custom sorting (positive for ascending, negative for descending). Arrays enable multi-column sorting.
=GROUPBY(B2:B32, C2:C32, SUM, , , 2) (Sorts by values)

=GROUPBY(B2:C32, D2:D32, SUM, , , {-1,2}) (Multi-column sort)

Filtering Results
Use filter_array (Boolean array) to filter rows.
=GROUPBY(B2:B32, C2:C32, SUM, , , , B2:B32<>"Design")

Aggregating Multiple Columns
Aggregate adjacent columns directly:
=GROUPBY(B2:B32, D2:E32, AVERAGE, 3)

For non-adjacent columns, use CHOOSECOLS:
=GROUPBY(B2:B32, CHOOSECOLS(C2:E32, 1, 3), AVERAGE, 3)

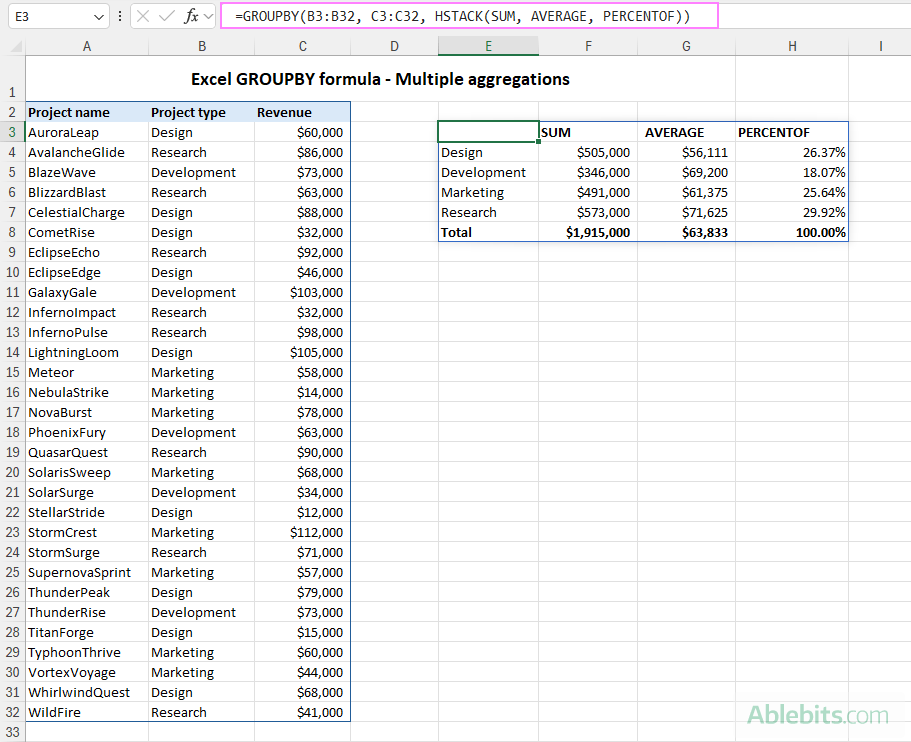
Multiple Aggregations on the Same Data
Use HSTACK or VSTACK for multiple aggregations:
=GROUPBY(B3:B32, C3:C32, HSTACK(SUM, AVERAGE, PERCENTOF))
=GROUPBY(B3:B32, C3:C32, VSTACK(SUM, AVERAGE, MIN, MAX),, 0)

Grouping Comma-Separated Text Values
Use ARRAYTOTEXT to group comma-separated text:
=GROUPBY(B3:B23, A3:A23, ARRAYTOTEXT, 0, 0)

Conditional Formatting of GROUPBY Results
Enhance visual clarity using conditional formatting to highlight headers, totals, and subtotals.
Troubleshooting GROUPBY Function Issues
- Function Unavailability: Ensure you have a Microsoft 365 subscription and the latest updates.
-
#VALUE!Error: Check for equal lengths inrow_fieldsandvaluesarguments, and ensure correctfilter_arraylength. Also, verify thattotal_depthis appropriate for the number of columns inrow_fields. -
#SPILL!Error: Clear adjacent cells to allow spill range.
In conclusion, the GROUPBY function significantly enhances Excel's data analysis capabilities, providing a powerful and efficient tool for various data manipulation tasks. With practice, you'll unlock its full potential for insightful data analysis.
以上是excel groupby函數可分組行和匯總值的詳細內容。更多資訊請關注PHP中文網其他相關文章!

熱AI工具

Undresser.AI Undress
人工智慧驅動的應用程序,用於創建逼真的裸體照片

AI Clothes Remover
用於從照片中去除衣服的線上人工智慧工具。

Undress AI Tool
免費脫衣圖片

Clothoff.io
AI脫衣器

Video Face Swap
使用我們完全免費的人工智慧換臉工具,輕鬆在任何影片中換臉!

熱門文章
熱工具

記事本++7.3.1
好用且免費的程式碼編輯器

SublimeText3漢化版
中文版,非常好用

禪工作室 13.0.1
強大的PHP整合開發環境

Dreamweaver CS6
視覺化網頁開發工具

SublimeText3 Mac版
神級程式碼編輯軟體(SublimeText3)


 如何將日曆添加到Outlook:共享,Internet日曆,ICAL文件
Apr 03, 2025 am 09:06 AM
如何將日曆添加到Outlook:共享,Internet日曆,ICAL文件
Apr 03, 2025 am 09:06 AM
本文介紹瞭如何在Outlook Desktop應用程序中訪問和利用共享日曆,包括導入Icalendar文件。 以前,我們介紹了分享您的Outlook日曆。 現在,讓我們探索如何查看與之共享的日曆
 如何使用示例使用Flash Fill ofecl
Apr 05, 2025 am 09:15 AM
如何使用示例使用Flash Fill ofecl
Apr 05, 2025 am 09:15 AM
本教程為Excel的Flash Fill功能提供了綜合指南,這是一種可自動化數據輸入任務的強大工具。 它涵蓋了從定義和位置到高級用法和故障排除的各個方面。 了解Excel的FLA

 Excel共享工作簿:如何為多個用戶共享Excel文件
Apr 11, 2025 am 11:58 AM
Excel共享工作簿:如何為多個用戶共享Excel文件
Apr 11, 2025 am 11:58 AM
本教程提供了共享Excel工作簿,涵蓋各種方法,訪問控制和衝突解決方案的綜合指南。 現代Excel版本(2010年,2013年,2016年及以後)簡化了協作編輯,消除了M的需求
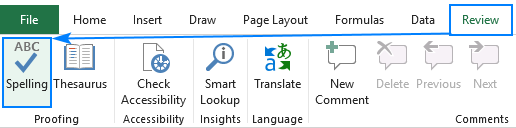 如何在Excel中拼寫檢查
Apr 06, 2025 am 09:10 AM
如何在Excel中拼寫檢查
Apr 06, 2025 am 09:10 AM
該教程展示了在Excel中進行拼寫檢查的各種方法:手動檢查,VBA宏和使用專用工具。 學習檢查單元格,範圍,工作表和整個工作簿中的拼寫。 雖然Excel不是文字處理器,但它的spel
 Google電子表格Countif函數帶有公式示例
Apr 11, 2025 pm 12:03 PM
Google電子表格Countif函數帶有公式示例
Apr 11, 2025 pm 12:03 PM
Google主張Countif:綜合指南 本指南探討了Google表中的多功能Countif函數,展示了其超出簡單單元格計數的應用程序。 我們將介紹從精確和部分比賽到Han的各種情況
 Excel中的絕對值:ABS功能與公式示例
Apr 06, 2025 am 09:12 AM
Excel中的絕對值:ABS功能與公式示例
Apr 06, 2025 am 09:12 AM
本教程解釋了絕對價值的概念,並演示了ABS函數的實用Excel應用,以計算數據集中的絕對值。 數字可能是正面的或負數的,但有時只有正值是需要的
 Excel:組行自動或手動,崩潰並擴展行
Apr 08, 2025 am 11:17 AM
Excel:組行自動或手動,崩潰並擴展行
Apr 08, 2025 am 11:17 AM
本教程演示瞭如何通過對行進行分組來簡化複雜的Excel電子表格,從而使數據易於分析。學會快速隱藏或顯示行組,並將整個輪廓崩潰到特定的級別。 大型的詳細電子表格可以是
