

图形类->gd.class.php

图形
class GD{
/*
函数说明
$data:y轴数据(数组)
$graphdata:y轴数据--百分比(数组)
$label:x轴数据(数组)
$height:图像高度
$width:图像宽度
$font:字号
$dot:决定点的大小
$bg:背景色
$line :线色
$text :文本色
$dotcolor:点色
$file:输出图像文件名
*/
//线形图的函数
function qximage($data , $graphdata, $label , $height, $width , $font, $dot, $bg, $line, $text, $dotcolor, $file)
{
$jc=$height/100;
$fontwidth= imagefontwidth ($font);
$fontheight=imagefontheight($font);
$image= imagecreate ($width,$height+20);
$bg= imagecolorallocate($image ,$bg[0],$bg[1],$bg[2]);
$line=imagecolorallocate($image ,$line[0],$line[1],$line[2]);
$text=imagecolorallocate($image ,$text[0],$text[1],$text[2]);
$dotcolor=imagecolorallocate($image ,$dotcolor[0],$dotcolor[1],$$dotcolor[2]);
imageline ($image,0,0,0,$height,$line);
imageline($image,0,$height,$width,$height,$line);
for ($i=1;$i{
imagedashedline($image,0,$height - $jc*$i*10 ,$width ,$height -$jc*$i*10 ,$line );
imagestring ($image,$font,0,$height-$jc*$i*10,$i*10,$text);
}
for ($i=0;$i {
#echo $tmp." ";
$x1=(($width-50)/count($data))*($i)+40;
#echo $x1 ." ";
$y1=$height-$graphdata[$i]*$jc;
$x2=$x1;
$y2=$y1+$graphdata[$i]*$jc;
#echo $y1." ";
imagestring($image,$font,$x1,$y1-2*$fontheight,$graphdata[$i]."%(".$data[$i].")",$text);
imagearc ($image,$x1 ,$y1,$dot,$dot,0,360,$dotcolor);
imagefilltoborder ($image,$x1,$y1,$dotcolor,$dotcolor);
imagestring ($image,$font,$x1,$y2,$label[$i],$text);
if ($i>0)
{
imageline($image,$tmpx1,$tmpy1,$x1,$y1,$line);
}
$tmpx1=$x1;$tmpy1=$y1;
}
imagegif ($image,$file);
}
//为了方便起见,我又做了一个函数来制作柱型图
/*参数说明:
$graphdata:百分比数据(y轴)
$label:x轴标题
$data:实际数据(y轴)
$graphwidth:图像宽度
$graphheight:图像高度
$graphscale:高度因子(为$graphheight/100)
$graphfont:字体号
$bg;背景颜色值
$text:文本颜色值
$grid:边线颜色值
$bar:柱的颜色值
$bz:备注(不支持中文呀)
*/
function timage(
$graphdata,$label,$data,
$graphwidth,$graphheight,$graphscale,$graphfont,
$bg,$text,$grid,$bar,$bz)
{
header("Content-type:image/gif");
$image=imagecreate($graphwidth+50,$graphheight+50);
$bgcolor= imagecolorallocate ($image ,$bg[0],$bg[1],$bg[2]);
$textcolor= imagecolorallocate ($image ,$text[0],$text[1],$text[2]);
$gridcolor=imagecolorallocate ($image ,$grid[0],$grid[1],$grid[2]);
$barcolor=imagecolorallocate ($image ,$bar[0],$bar[1],$bar[2]);
$gridabelwidth=imagefontwidth($graphfont)*3+1;
$gridableheight= imagefontheight ($graphfont);
imageline($image,$gridlabelwidth,0,$gridlabelwidth,$graphheight-1,$gridcolor);
imageline($image,0,$graphheight-1,$graphwidth-1,$graphheight-1,$gridcolor);
for($i=0;$i {
imagedashedline ($image,0,$i,$graphwidth-1,$i,$gridcolor);
imagestring($image,$graphfont,0,$i,round(($graphheight-$i)/$graphscale),$textcolor);
}
$barwidth=(($graphwidth-$gridlabelwidth)/count($graphdata))-30;#¿ØÖÆÖùµÄ×Ü¿í¶È
for($i=0;$i {
$bartopx=$gridlabelwidth+(($i+1)*20)+($i*$barwidth);#¿ØÖÆÖù¿¿×óµÄ¾àÀë
$barbottomx=$bartopx+$barwidth; $barbottomy=$graphheight-1;#¿ØÖÆÖùµÄϱ߽ç
$bartopy=$barbottomy-($graphdata[$i]*$graphscale);
imagefilledrectangle($image,$bartopx,$bartopy,$barbottomx,$barbottomy,$barcolor);
$labelx1=$bartopx;
$labely1=$bartopy-15;
$labelx2=$bartopx;
$labely2=$graphheight;
imagestring($image,$graphfont,$labelx1,$labely1,"$graphdata[$i]"."%",$textcolor);
imagestring($image,$graphfont,$labelx2,$labely2,"$label[$i]",$textcolor);
imagestringup ($image,$graphfont,$labelx1+10,$labely1-$gridableheight,"$data[$i]",$textcolor);
}
imagestring($image,$graphfont,1,$graphheight+30,$bz,$textcolor);
imagegif ($image);
}
//PHP数据饼图
define("ANGLE_STEP", 5); //定义画椭圆弧时的角度步长
function draw_getdarkcolor($img,$clr) //求$clr对应的暗色
{
$rgb = imagecolorsforindex($img,$clr);
return array($rgb["red"]/2,$rgb["green"]/2,$rgb["blue"]/2);
}
function draw_getexy($a, $b, $d) //求角度$d对应的椭圆上的点坐标
{
$d = deg2rad($d);
return array(round($a*Cos($d)), round($b*Sin($d)));
}
function draw_arc($img,$ox,$oy,$a,$b,$sd,$ed,$clr) //椭圆弧函数
{
$n = ceil(($ed-$sd)/ANGLE_STEP);
$d = $sd;
list($x0,$y0) = draw_getexy($a,$b,$d);
for($i=0; $i
{
$d = ($d+ANGLE_STEP)>$ed?$ed:($d+ANGLE_STEP);
list($x, $y) = draw_getexy($a, $b, $d);
imageline($img, $x0+$ox, $y0+$oy, $x+$ox, $y+$oy, $clr);
$x0 = $x;
$y0 = $y;
}
}
function draw_sector($img, $ox, $oy, $a, $b, $sd, $ed, $clr) //画扇面
{
$n = ceil(($ed-$sd)/ANGLE_STEP);
$d = $sd;
list($x0,$y0) = draw_getexy($a, $b, $d);
imageline($img, $x0+$ox, $y0+$oy, $ox, $oy, $clr);
for($i=0; $i {
$d = ($d+ANGLE_STEP)>$ed?$ed:($d+ANGLE_STEP);
list($x, $y) = draw_getexy($a, $b, $d);
imageline($img, $x0+$ox, $y0+$oy, $x+$ox, $y+$oy, $clr);
$x0 = $x;
$y0 = $y;
}
imageline($img, $x0+$ox, $y0+$oy, $ox, $oy, $clr);
list($x, $y) = draw_getexy($a/2, $b/2, ($d+$sd)/2);
imagefill($img, $x+$ox, $y+$oy, $clr);
}
function draw_sector3d($img, $ox, $oy, $a, $b, $v, $sd, $ed, $clr) //3d扇面
{
draw_sector($img, $ox, $oy, $a, $b, $sd, $ed, $clr);
if($sd {
list($R, $G, $B) = draw_getdarkcolor($img, $clr);
$clr=imagecolorallocate($img, $R, $G, $B);
if($ed>180) $ed = 180;
list($sx, $sy) = draw_getexy($a,$b,$sd);
$sx += $ox;
$sy += $oy;
list($ex, $ey) = draw_getexy($a, $b, $ed);
$ex += $ox;
$ey += $oy;
imageline($img, $sx, $sy, $sx, $sy+$v, $clr);
imageline($img, $ex, $ey, $ex, $ey+$v, $clr);
draw_arc($img, $ox, $oy+$v, $a, $b, $sd, $ed, $clr);
list($sx, $sy) = draw_getexy($a, $b, ($sd+$ed)/2);
$sy += $oy+$v/2;
$sx += $ox;
imagefill($img, $sx, $sy, $clr);
}
}
function draw_getindexcolor($img, $clr) //RBG转索引色
{
$R = ($clr>>16) & 0xff;
$G = ($clr>>8)& 0xff;
$B = ($clr) & 0xff;
return imagecolorallocate($img, $R, $G, $B);
}
// 绘图主函数,并输出图片
// $datLst 为数据数组, $datLst 为标签数组, $datLst 为颜色数组
// 以上三个数组的维数应该相等
function draw_img($datLst,$labLst,$clrLst,$a=250,$b=120,$v=20,$font=10)
{
$ox = 5+$a;
$oy = 5+$b;
$fw = imagefontwidth($font);
$fh = imagefontheight($font);
$n = count($datLst);//数据项个数
$w = 10+$a*2;
$h = 10+$b*2+$v+($fh+2)*$n;
$img = imagecreate($w, $h);
//转RGB为索引色
for($i=0; $i $clrLst[$i] = draw_getindexcolor($img,$clrLst[$i]);
$clrbk = imagecolorallocate($img, 0xff, 0xff, 0xff);
$clrt = imagecolorallocate($img, 0x00, 0x00, 0x00);
//填充背景色
imagefill($img, 0, 0, $clrbk);
//求和
$tot = 0;
for($i=0; $i $tot += $datLst[$i];
$sd = 0;
$ed = 0; 333
$ly = 10+$b*2+$v;
for($i=0; $i {
$sd = $ed;
$ed += $datLst[$i]/$tot*360;
//画圆饼
draw_sector3d($img, $ox, $oy, $a, $b, $v, $sd, $ed, $clrLst[$i]); //$sd,$ed,$clrLst[$i]);
//画标签
imagefilledrectangle($img, 5, $ly, 5+$fw, $ly+$fh, $clrLst[$i]);
imagerectangle($img, 5, $ly, 5+$fw, $ly+$fh, $clrt);
//imagestring($img, $font, 5+2*$fw, $ly, $labLst[$i].":".$datLst[$i]."(".(round(10000*($datLst[$i]/$tot))/100)."%)", $clrt);
$str = iconv("GB2312", "UTF-8", $labLst[$i]);
ImageTTFText($img, $font, 0, 5+2*$fw, $ly+13, $clrt, "./simsun.ttf", $str.":".$datLst[$i]."(".(round(10000*($datLst[$i]/$tot))/100)."%)");
$ly += $fh+2;
}
//输出图形
header("Content-type: image/png");
//输出生成的图片
$imgFileName = "../temp/".time().".png";
imagepng($img,$imgFileName);
echo ' ';
';
}
$datLst = array(30, 10, 20, 20, 10, 20, 10, 20); //数据
$labLst = array("中国科技大学", "安徽理工大学", "清华大学", "北京大学", "南京大学", "上海大学", "河海大学", "中山大学"); //标签
$clrLst = array(0x99ff00, 0xff6666, 0x0099ff, 0xff99ff, 0xffff99, 0x99ffff, 0xff3333, 0x009999);
//画图
draw_img($datLst,$labLst,$clrLst);
?>
?>

熱AI工具

Undresser.AI Undress
人工智慧驅動的應用程序,用於創建逼真的裸體照片

AI Clothes Remover
用於從照片中去除衣服的線上人工智慧工具。

Undress AI Tool
免費脫衣圖片

Clothoff.io
AI脫衣器

AI Hentai Generator
免費產生 AI 無盡。

熱門文章
熱工具

記事本++7.3.1
好用且免費的程式碼編輯器

SublimeText3漢化版
中文版,非常好用

禪工作室 13.0.1
強大的PHP整合開發環境

Dreamweaver CS6
視覺化網頁開發工具

SublimeText3 Mac版
神級程式碼編輯軟體(SublimeText3)
熱門話題


 解決方法:您的組織要求您更改 PIN 碼
Oct 04, 2023 pm 05:45 PM
解決方法:您的組織要求您更改 PIN 碼
Oct 04, 2023 pm 05:45 PM
「你的組織要求你更改PIN訊息」將顯示在登入畫面上。當在使用基於組織的帳戶設定的電腦上達到PIN過期限制時,就會發生這種情況,在該電腦上,他們可以控制個人設備。但是,如果您使用個人帳戶設定了Windows,則理想情況下不應顯示錯誤訊息。雖然情況並非總是如此。大多數遇到錯誤的使用者使用個人帳戶報告。為什麼我的組織要求我在Windows11上更改我的PIN?可能是您的帳戶與組織相關聯,您的主要方法應該是驗證這一點。聯絡網域管理員會有所幫助!此外,配置錯誤的本機原則設定或不正確的登錄項目也可能導致錯誤。即
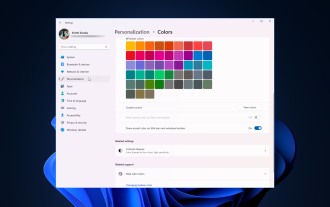 Windows 11 上調整視窗邊框設定的方法:變更顏色和大小
Sep 22, 2023 am 11:37 AM
Windows 11 上調整視窗邊框設定的方法:變更顏色和大小
Sep 22, 2023 am 11:37 AM
Windows11將清新優雅的設計帶到了最前沿;現代介面可讓您個性化和更改最精細的細節,例如視窗邊框。在本指南中,我們將討論逐步說明,以協助您在Windows作業系統中建立反映您的風格的環境。如何更改視窗邊框設定?按+開啟“設定”應用程式。 WindowsI前往個人化,然後按一下顏色設定。顏色變更視窗邊框設定視窗11「寬度=」643「高度=」500「>找到在標題列和視窗邊框上顯示強調色選項,然後切換它旁邊的開關。若要在「開始」功能表和工作列上顯示主題色,請開啟「在開始」功能表和工作列上顯示主題
 img檔案怎麼打開
Sep 18, 2023 am 09:40 AM
img檔案怎麼打開
Sep 18, 2023 am 09:40 AM
開啟img檔案的方法有使用虛擬光碟機軟體開啟、使用壓縮軟體開啟和使用專用工具開啟。詳細介紹:1、使用虛擬光碟機軟體打開,下載並安裝一個虛擬光碟機軟體,右鍵單擊img文件,選擇“打開方式”或“關聯程序”,在彈出的對話框中選擇安裝的虛擬光驅軟體,虛擬光碟機軟體會自動載入img文件,並將其作為虛擬光碟機中的光碟映像,雙擊虛擬光碟機中的光碟圖標,即可開啟img檔案並存取其中的內容等等。
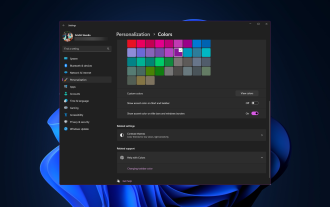 如何在 Windows 11 上變更標題列顏色?
Sep 14, 2023 pm 03:33 PM
如何在 Windows 11 上變更標題列顏色?
Sep 14, 2023 pm 03:33 PM
預設情況下,Windows11上的標題列顏色取決於您選擇的深色/淺色主題。但是,您可以將其變更為所需的任何顏色。在本指南中,我們將討論三種方法的逐步說明,以更改它並個性化您的桌面體驗,使其具有視覺吸引力。是否可以更改活動和非活動視窗的標題列顏色?是的,您可以使用「設定」套用變更活動視窗的標題列顏色,也可以使用登錄編輯程式變更非活動視窗的標題列顏色。若要了解這些步驟,請前往下一部分。如何在Windows11中變更標題列的顏色? 1.使用「設定」應用程式按+開啟設定視窗。 WindowsI前往“個人化”,然
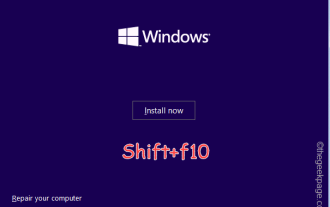 OOBELANGUAGE錯誤Windows 11 / 10修復中出現問題的問題
Jul 16, 2023 pm 03:29 PM
OOBELANGUAGE錯誤Windows 11 / 10修復中出現問題的問題
Jul 16, 2023 pm 03:29 PM
您是否在Windows安裝程式頁面上看到「出現問題」以及「OOBELANGUAGE」語句? Windows的安裝有時會因此類錯誤而停止。 OOBE表示開箱即用的體驗。正如錯誤提示所表示的那樣,這是與OOBE語言選擇相關的問題。沒有什麼好擔心的,你可以透過OOBE螢幕本身的漂亮註冊表編輯來解決這個問題。快速修復–1.點選OOBE應用底部的「重試」按鈕。這將繼續進行該過程,而不會再打嗝。 2.使用電源按鈕強制關閉系統。系統重新啟動後,OOBE應繼續。 3.斷開系統與網際網路的連接。在脫機模式下完成OOBE的所
 Windows 11 上啟用或停用工作列縮圖預覽的方法
Sep 15, 2023 pm 03:57 PM
Windows 11 上啟用或停用工作列縮圖預覽的方法
Sep 15, 2023 pm 03:57 PM
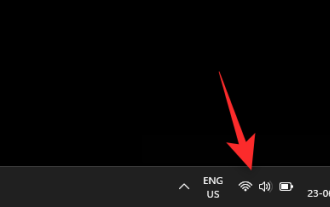
工作列縮圖可能很有趣,但它們也可能分散注意力或煩人。考慮到您將滑鼠懸停在該區域的頻率,您可能無意中關閉了重要視窗幾次。另一個缺點是它使用更多的系統資源,因此,如果您一直在尋找一種提高資源效率的方法,我們將向您展示如何停用它。不過,如果您的硬體規格可以處理它並且您喜歡預覽版,則可以啟用它。如何在Windows11中啟用工作列縮圖預覽? 1.使用「設定」應用程式點擊鍵並點選設定。 Windows按一下系統,然後選擇關於。點選高級系統設定。導航至“進階”選項卡,然後選擇“效能”下的“設定”。在「視覺效果」選
 Windows 11 上的顯示縮放比例調整指南
Sep 19, 2023 pm 06:45 PM
Windows 11 上的顯示縮放比例調整指南
Sep 19, 2023 pm 06:45 PM
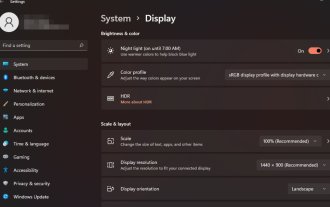
在Windows11上的顯示縮放方面,我們都有不同的偏好。有些人喜歡大圖標,有些人喜歡小圖標。但是,我們都同意擁有正確的縮放比例很重要。字體縮放不良或圖像過度縮放可能是工作時真正的生產力殺手,因此您需要知道如何自訂以充分利用系統功能。自訂縮放的優點:對於難以閱讀螢幕上的文字的人來說,這是一個有用的功能。它可以幫助您一次在螢幕上查看更多內容。您可以建立僅適用於某些監視器和應用程式的自訂擴充功能設定檔。可以幫助提高低階硬體的效能。它使您可以更好地控制螢幕上的內容。如何在Windows11
 10種在 Windows 11 上調整亮度的方法
Dec 18, 2023 pm 02:21 PM
10種在 Windows 11 上調整亮度的方法
Dec 18, 2023 pm 02:21 PM
螢幕亮度是使用現代計算設備不可或缺的一部分,尤其是當您長時間注視螢幕時。它可以幫助您減輕眼睛疲勞,提高易讀性,並輕鬆有效地查看內容。但是,根據您的設置,有時很難管理亮度,尤其是在具有新UI更改的Windows11上。如果您在調整亮度時遇到問題,以下是在Windows11上管理亮度的所有方法。如何在Windows11上變更亮度[10種方式解釋]單一顯示器使用者可以使用下列方法在Windows11上調整亮度。這包括使用單一顯示器的桌上型電腦系統以及筆記型電腦。讓我們開始吧。方法1:使用操作中心操作中心是訪問
